Estimated Value: $170,000 - $189,935
Studio
1
Bath
1,125
Sq Ft
$159/Sq Ft
Est. Value
About This Home
This home is located at 8063 N 2000 East Rd, Downs, IL 61736 and is currently estimated at $179,234, approximately $159 per square foot. 8063 N 2000 East Rd is a home located in McLean County with nearby schools including Tri-Valley Elementary School, Tri-Valley Middle School, and Tri-Valley High School.
Ownership History
Date
Name
Owned For
Owner Type
Purchase Details
Closed on
Sep 28, 2020
Sold by
Graf Patricia K and Estate Of Tyler J Graf
Bought by
Hall Tristen M
Current Estimated Value
Home Financials for this Owner
Home Financials are based on the most recent Mortgage that was taken out on this home.
Original Mortgage
$101,315
Outstanding Balance
$89,448
Interest Rate
2.5%
Mortgage Type
New Conventional
Estimated Equity
$89,786
Purchase Details
Closed on
May 25, 2012
Sold by
Reeves Craig D
Bought by
Graf Tyler
Home Financials for this Owner
Home Financials are based on the most recent Mortgage that was taken out on this home.
Original Mortgage
$109,250
Interest Rate
3.92%
Purchase Details
Closed on
Dec 18, 2005
Sold by
Reeves Craig D and Wolfe Michelle
Bought by
Reeves Craig D
Home Financials for this Owner
Home Financials are based on the most recent Mortgage that was taken out on this home.
Original Mortgage
$80,000
Interest Rate
6.48%
Create a Home Valuation Report for This Property
The Home Valuation Report is an in-depth analysis detailing your home's value as well as a comparison with similar homes in the area
Purchase History
| Date | Buyer | Sale Price | Title Company |
|---|---|---|---|
| Hall Tristen M | $105,000 | Mclean County Title | |
| Graf Tyler | $115,000 | Attorneys Title Guaranty Fun | |
| Reeves Craig D | -- | None Available |
Source: Public Records
Mortgage History
| Date | Status | Borrower | Loan Amount |
|---|---|---|---|
| Open | Hall Tristen M | $101,315 | |
| Previous Owner | Graf Tyler | $109,250 | |
| Previous Owner | Reeves Craig D | $80,000 |
Source: Public Records
Tax History
| Year | Tax Paid | Tax Assessment Tax Assessment Total Assessment is a certain percentage of the fair market value that is determined by local assessors to be the total taxable value of land and additions on the property. | Land | Improvement |
|---|---|---|---|---|
| 2024 | $3,184 | $52,331 | $13,090 | $39,241 |
| 2022 | $3,184 | $44,198 | $10,623 | $33,575 |
| 2021 | $3,062 | $42,506 | $10,216 | $32,290 |
| 2020 | $3,066 | $42,506 | $10,216 | $32,290 |
| 2019 | $3,066 | $42,506 | $10,216 | $32,290 |
| 2018 | $3,040 | $42,173 | $10,136 | $32,037 |
| 2017 | $2,983 | $41,464 | $9,966 | $31,498 |
| 2016 | $2,961 | $41,082 | $9,874 | $31,208 |
| 2015 | $2,924 | $40,788 | $9,803 | $30,985 |
| 2014 | $2,756 | $39,945 | $9,600 | $30,345 |
| 2013 | -- | $31,245 | $2,900 | $28,345 |
Source: Public Records
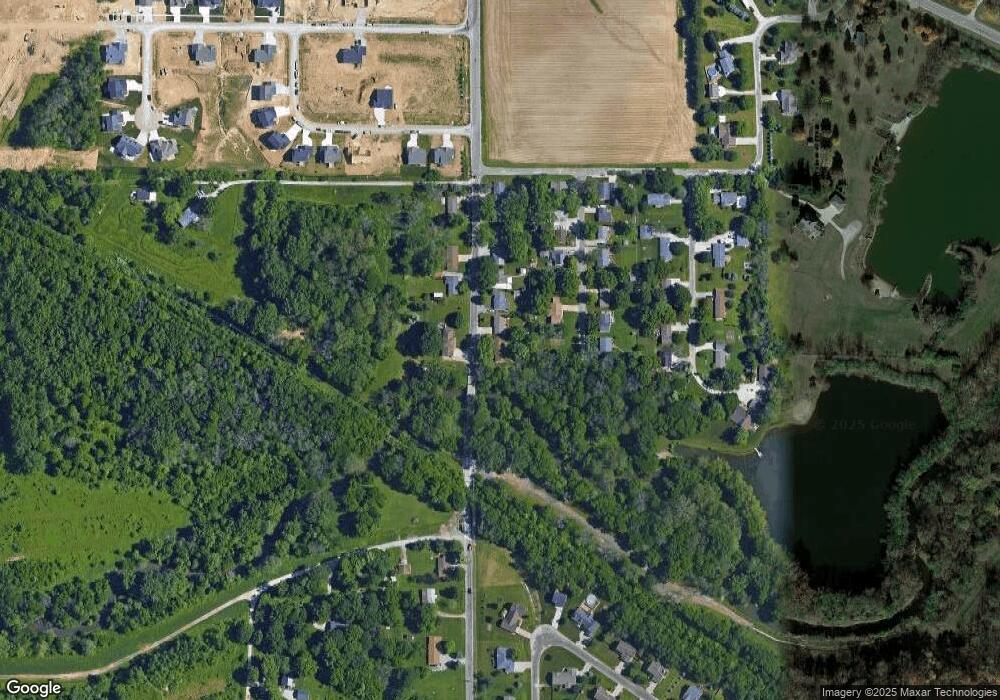
Map
Nearby Homes
- 8021 Pine Ave
- 8198 Pine Ave
- 500 Raef Rd
- 8710 N 2100 East Rd
- 19889 Jared Dr
- 9580 Janel Dr
- Lot 8 E 700 Rd N
- 19977 Jared Dr
- 19066 Woodland Trail
- 18864 Pioneer St
- Lot 7 Burr Oak Ln
- 3903 Dunloe Place
- 1922 Dunraven Rd
- 1915 Dunraven Rd
- 1906 Dunraven Rd
- 1517 Kell Ave
- 5104 Finlen Ln
- 6105 Wrigley Dr
- 5101 Londonderry Rd
- 5802 Sugarberry Ave
- 8075 N 2000 East Rd
- 8075 N 2000 East Rd
- 8095 N. 2000 Rd E
- 8095 N 2000 Rd E
- 8060 N 2000 East Rd
- 8115 N 2000 East Rd
- 8115 N 2000 East Rd
- 8100 Pine Ave
- 8601 N 2000 Rd E
- 8133 N 2000 East Rd
- 8106 N 2000 East Rd
- 8106 N 2000 East Rd
- 8021 Pine Dr
- 8043 Pine Ave
- 8130 N 2000 Rd E
- 8130 Pine Ave
- 8081 Pine Ave
- 8135 Pine Ave
- 8163 N 2000 East Rd
- 8169 Pine Ave
Your Personal Tour Guide
Ask me questions while you tour the home.