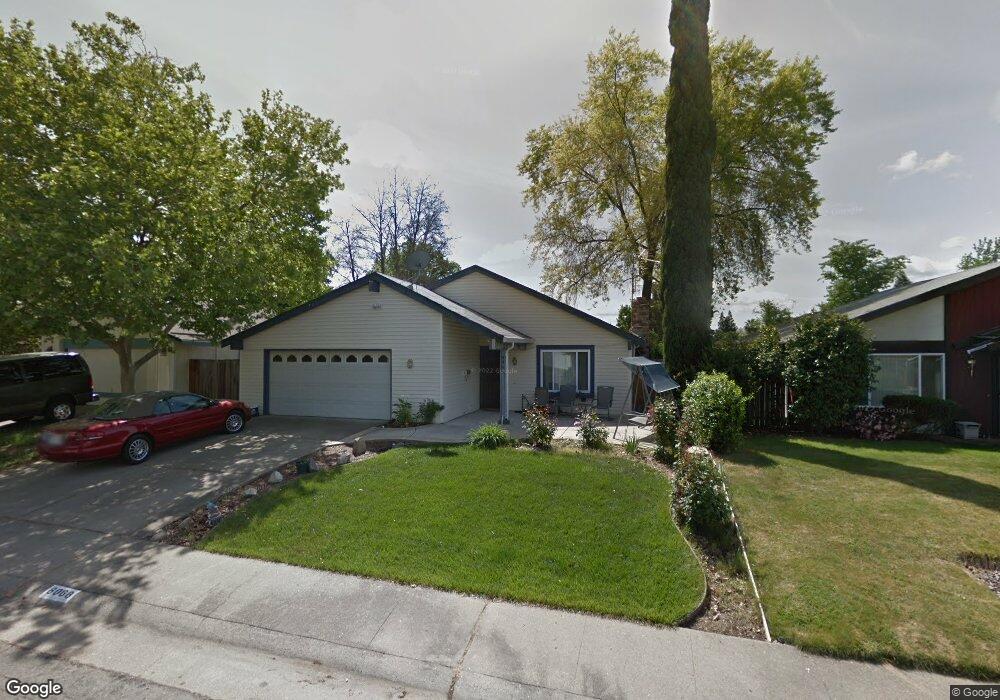
8066 Camstock Ct Citrus Heights, CA 95610
Estimated Value: $466,365 - $509,000
4
Beds
2
Baths
1,564
Sq Ft
$313/Sq Ft
Est. Value
About This Home
This home is located at 8066 Camstock Ct, Citrus Heights, CA 95610 and is currently estimated at $489,591, approximately $313 per square foot. 8066 Camstock Ct is a home located in Sacramento County with nearby schools including Kingswood K-8, San Juan High School, and Country Hill Montessori School.
Ownership History
Date
Name
Owned For
Owner Type
Purchase Details
Closed on
Nov 9, 2015
Sold by
Givan Axford Edwina and Axford Michael
Bought by
Axford Givan Living Trust
Current Estimated Value
Home Financials for this Owner
Home Financials are based on the most recent Mortgage that was taken out on this home.
Original Mortgage
$411,750
Interest Rate
3.24%
Mortgage Type
Reverse Mortgage Home Equity Conversion Mortgage
Purchase Details
Closed on
Aug 17, 2015
Sold by
Givan Axford Edwina and Axford Michael
Bought by
Axford Michael and Givan Axford Edwina Sue
Purchase Details
Closed on
Jan 16, 2003
Sold by
Givan Axford Edwina S and Givan Edwina S
Bought by
Axford Michael and Givan Axford Edwina
Home Financials for this Owner
Home Financials are based on the most recent Mortgage that was taken out on this home.
Original Mortgage
$25,600
Interest Rate
5.96%
Mortgage Type
Stand Alone Second
Purchase Details
Closed on
Jun 26, 1997
Sold by
Givan Evans
Bought by
Givan Edwina S
Create a Home Valuation Report for This Property
The Home Valuation Report is an in-depth analysis detailing your home's value as well as a comparison with similar homes in the area
Home Values in the Area
Average Home Value in this Area
Purchase History
| Date | Buyer | Sale Price | Title Company |
|---|---|---|---|
| Axford Givan Living Trust | -- | Stewart Title Of Ca Inc | |
| Axford Michael | -- | None Available | |
| Axford Michael | -- | Chicago Title Company | |
| Givan Edwina S | -- | -- |
Source: Public Records
Mortgage History
| Date | Status | Borrower | Loan Amount |
|---|---|---|---|
| Closed | Axford Givan Living Trust | $411,750 | |
| Closed | Axford Michael | $25,600 |
Source: Public Records
Tax History Compared to Growth
Tax History
| Year | Tax Paid | Tax Assessment Tax Assessment Total Assessment is a certain percentage of the fair market value that is determined by local assessors to be the total taxable value of land and additions on the property. | Land | Improvement |
|---|---|---|---|---|
| 2025 | $2,112 | $184,352 | $51,775 | $132,577 |
| 2024 | $2,112 | $180,738 | $50,760 | $129,978 |
| 2023 | $2,057 | $177,195 | $49,765 | $127,430 |
| 2022 | $2,045 | $173,722 | $48,790 | $124,932 |
| 2021 | $2,010 | $170,317 | $47,834 | $122,483 |
| 2020 | $1,972 | $168,572 | $47,344 | $121,228 |
| 2019 | $1,931 | $165,267 | $46,416 | $118,851 |
| 2018 | $1,904 | $162,027 | $45,506 | $116,521 |
| 2017 | $1,887 | $158,851 | $44,614 | $114,237 |
| 2016 | $1,762 | $155,738 | $43,740 | $111,998 |
| 2015 | $1,731 | $153,399 | $43,083 | $110,316 |
| 2014 | $1,694 | $150,396 | $42,240 | $108,156 |
Source: Public Records
Map
Nearby Homes
- 8033 Larwin Dr
- 7001 Checkerbloom Way
- 8122 Stacey Hills Dr
- 8052 Cammeray Dr
- 7156 Woodmore Oaks Dr
- 7080 Canelo Hills Dr
- 7970 Larwin Dr
- 8047 Mcclung Dr
- 8075 Alma Mesa Way
- 7963 Arcade Lake Ln
- 7975 Arcade Lake Ln
- 6601 Smoke Tree Ct
- 8033 Arcade Lake Ln
- 7921 Arcade Lake Ln Unit 6
- 7919 Arcade Lake Ln
- 7907 Arcade Lake Ln Unit 4
- 8230 Streng Ave
- 6813 Mellodora Dr
- 6736 Wyatt Cir
- 6732 Wyatt Cir
- 8058 Camstock Ct
- 8067 Oak Meadow Ct
- 8074 Camstock Ct
- 8071 Oak Meadow Ct
- 8063 Oak Meadow Ct
- 8075 Oak Meadow Ct
- 8067 Camstock Ct
- 8059 Oak Meadow Ct
- 8054 Camstock Ct
- 8071 Camstock Ct
- 8063 Camstock Ct
- 8075 Camstock Ct
- 8055 Oak Meadow Ct
- 8078 Camstock Ct
- 8079 Oak Meadow Ct
- 8050 Camstock Ct
- 8055 Camstock Ct
- 8082 Camstock Ct
- 8079 Camstock Ct
- 8066 Oak Meadow Ct