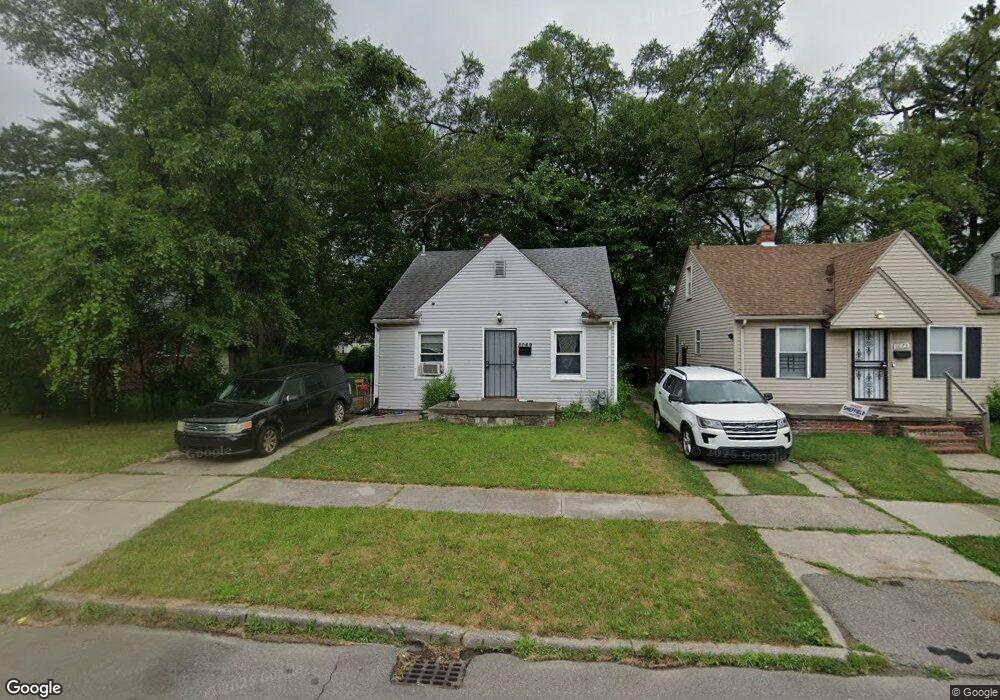
8069 Lauder St Detroit, MI 48228
Fiskhorn NeighborhoodEstimated Value: $67,000 - $89,000
2
Beds
1
Bath
768
Sq Ft
$98/Sq Ft
Est. Value
About This Home
This home is located at 8069 Lauder St, Detroit, MI 48228 and is currently estimated at $74,930, approximately $97 per square foot. 8069 Lauder St is a home located in Wayne County with nearby schools including Barton Elementary School, Charles L. Spain Elementary-Middle School, and Edward 'Duke' Ellington Conservatory of Music and Art.
Ownership History
Date
Name
Owned For
Owner Type
Purchase Details
Closed on
Sep 9, 2024
Sold by
Demilio Sal
Bought by
Strategic Realty Holdings Llc
Current Estimated Value
Purchase Details
Closed on
Dec 22, 2008
Sold by
Fs Investments Llc
Bought by
Demillio Sal
Purchase Details
Closed on
Sep 13, 2007
Sold by
Cope Benny
Bought by
Hsbc Bank Usa Na and Ace Securities Corp Home Equity Loan Tru
Purchase Details
Closed on
May 11, 2006
Sold by
R Burnett Co Llc
Bought by
Cope Benny
Purchase Details
Closed on
Jan 6, 2004
Sold by
Holt Thomas
Bought by
R Burnett Co Llc
Create a Home Valuation Report for This Property
The Home Valuation Report is an in-depth analysis detailing your home's value as well as a comparison with similar homes in the area
Home Values in the Area
Average Home Value in this Area
Purchase History
| Date | Buyer | Sale Price | Title Company |
|---|---|---|---|
| Strategic Realty Holdings Llc | $28,000 | Speedy Title & Escrow Services | |
| Demillio Sal | -- | None Available | |
| Hsbc Bank Usa Na | $25,605 | None Available | |
| Cope Benny | $73,000 | None Available | |
| R Burnett Co Llc | $30,000 | Multiple | |
| Holt Thomas | -- | Multiple |
Source: Public Records
Tax History Compared to Growth
Tax History
| Year | Tax Paid | Tax Assessment Tax Assessment Total Assessment is a certain percentage of the fair market value that is determined by local assessors to be the total taxable value of land and additions on the property. | Land | Improvement |
|---|---|---|---|---|
| 2025 | $465 | $28,700 | $0 | $0 |
| 2024 | $465 | $23,500 | $0 | $0 |
| 2023 | $449 | $19,400 | $0 | $0 |
| 2022 | $466 | $15,000 | $0 | $0 |
| 2021 | $459 | $12,600 | $0 | $0 |
| 2020 | $459 | $11,500 | $0 | $0 |
| 2019 | $454 | $8,800 | $0 | $0 |
| 2018 | $422 | $7,500 | $0 | $0 |
| 2017 | $44 | $6,700 | $0 | $0 |
| 2016 | $445 | $2,700 | $0 | $0 |
| 2015 | $270 | $2,700 | $0 | $0 |
| 2013 | $332 | $3,324 | $0 | $0 |
| 2010 | -- | $4,762 | $769 | $3,993 |
Source: Public Records
Map
Nearby Homes