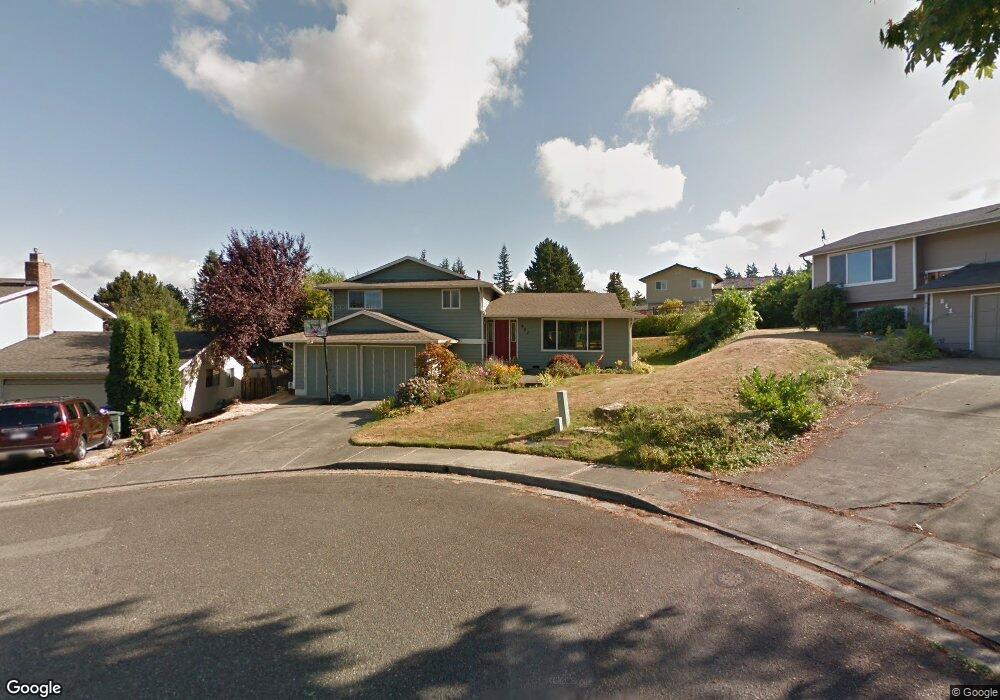
807 Bennett Ct Bellingham, WA 98229
Samish NeighborhoodEstimated Value: $618,000 - $790,000
3
Beds
2
Baths
1,818
Sq Ft
$398/Sq Ft
Est. Value
About This Home
This home is located at 807 Bennett Ct, Bellingham, WA 98229 and is currently estimated at $723,906, approximately $398 per square foot. 807 Bennett Ct is a home located in Whatcom County with nearby schools including Happy Valley Elementary School, Fairhaven Middle School, and Sehome High School.
Ownership History
Date
Name
Owned For
Owner Type
Purchase Details
Closed on
Apr 25, 2016
Sold by
Reynolds Lisa M
Bought by
Reynolds Lisa M and Walstad John
Current Estimated Value
Home Financials for this Owner
Home Financials are based on the most recent Mortgage that was taken out on this home.
Original Mortgage
$150,000
Outstanding Balance
$119,682
Interest Rate
3.73%
Mortgage Type
New Conventional
Estimated Equity
$604,224
Purchase Details
Closed on
May 20, 2011
Sold by
Reynolds David L
Bought by
Reynolds Lisa M
Purchase Details
Closed on
Nov 13, 2000
Sold by
Lee Hubert H and Lee Paula P N
Bought by
Reynolds David L and Reynolds Lisa M
Home Financials for this Owner
Home Financials are based on the most recent Mortgage that was taken out on this home.
Original Mortgage
$141,075
Interest Rate
7.86%
Create a Home Valuation Report for This Property
The Home Valuation Report is an in-depth analysis detailing your home's value as well as a comparison with similar homes in the area
Home Values in the Area
Average Home Value in this Area
Purchase History
| Date | Buyer | Sale Price | Title Company |
|---|---|---|---|
| Reynolds Lisa M | -- | Whatcom Land Title | |
| Reynolds Lisa M | -- | None Available | |
| Reynolds David L | $148,500 | Chicago Title Insurance |
Source: Public Records
Mortgage History
| Date | Status | Borrower | Loan Amount |
|---|---|---|---|
| Open | Reynolds Lisa M | $150,000 | |
| Previous Owner | Reynolds David L | $141,075 |
Source: Public Records
Tax History Compared to Growth
Tax History
| Year | Tax Paid | Tax Assessment Tax Assessment Total Assessment is a certain percentage of the fair market value that is determined by local assessors to be the total taxable value of land and additions on the property. | Land | Improvement |
|---|---|---|---|---|
| 2024 | $5,189 | $643,758 | $320,986 | $322,772 |
| 2023 | $5,189 | $666,774 | $332,462 | $334,312 |
| 2022 | $4,251 | $567,470 | $282,948 | $284,522 |
| 2021 | $3,951 | $457,649 | $228,190 | $229,459 |
| 2020 | $3,880 | $401,444 | $200,165 | $201,279 |
| 2019 | $3,344 | $381,057 | $190,000 | $191,057 |
| 2018 | $3,472 | $329,267 | $148,103 | $181,164 |
| 2017 | $3,059 | $292,270 | $131,460 | $160,810 |
| 2016 | $2,787 | $269,128 | $120,960 | $148,168 |
| 2015 | $2,743 | $255,242 | $114,660 | $140,582 |
| 2014 | -- | $243,082 | $109,200 | $133,882 |
| 2013 | -- | $231,423 | $105,000 | $126,423 |
Source: Public Records
Map
Nearby Homes
- 4007 Adams Ave
- 835 Samish Way
- 700 32nd St Unit A403
- 700 32nd St Unit A412
- 700 32nd St Unit A408
- 820 32nd St
- 690 32nd St Unit B205
- 4224 Dumas Ave
- 1105 40th St
- 3605 Mill Ave
- 921 Whitewater Dr
- 143 S 44th St
- 115 43rd St
- 805 Nevada St
- 1416 32nd St
- 1615 Samish Way
- 1800 40th Place
- 923 24th St
- 1205 E Maple St
- 905 Queen St