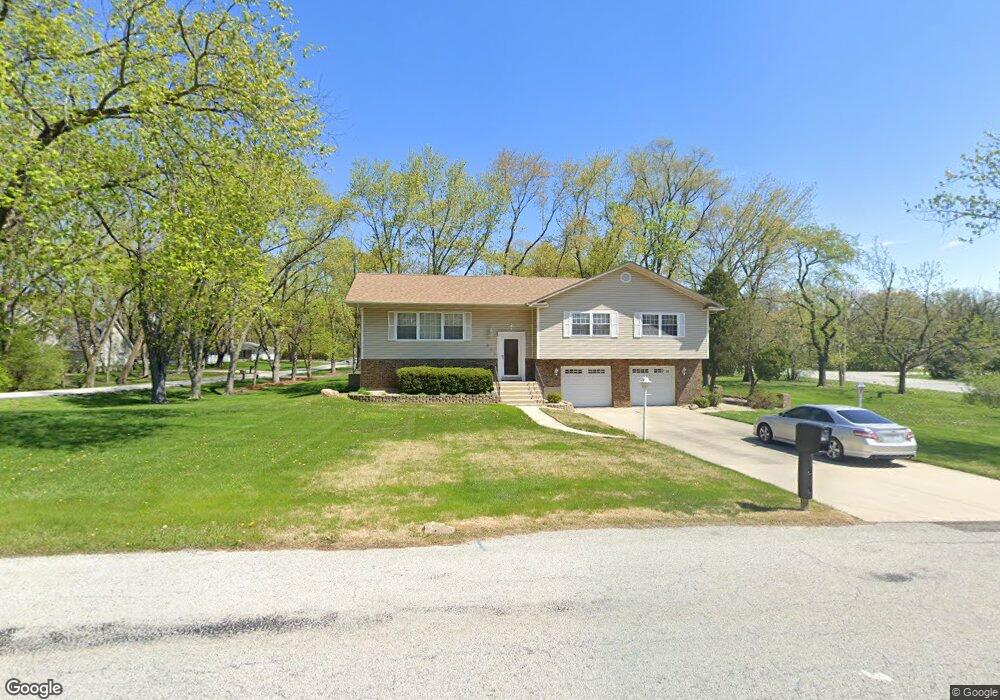
807 Exmoor Rd Olympia Fields, IL 60461
Estimated Value: $309,379 - $358,000
3
Beds
3
Baths
1,957
Sq Ft
$176/Sq Ft
Est. Value
About This Home
This home is located at 807 Exmoor Rd, Olympia Fields, IL 60461 and is currently estimated at $344,345, approximately $175 per square foot. 807 Exmoor Rd is a home located in Cook County with nearby schools including Illinois School, Arcadia Elementary School, and Indiana Elementary School.
Ownership History
Date
Name
Owned For
Owner Type
Purchase Details
Closed on
Oct 18, 2011
Sold by
Bradley Michael V and Bradley Annie L
Bought by
Griggs Kisha L
Current Estimated Value
Home Financials for this Owner
Home Financials are based on the most recent Mortgage that was taken out on this home.
Original Mortgage
$136,000
Outstanding Balance
$91,371
Interest Rate
4.02%
Mortgage Type
New Conventional
Estimated Equity
$252,974
Purchase Details
Closed on
Sep 10, 2007
Sold by
Bradley Michael V and Bradley Annie L
Bought by
Bradley Michael V and Bradley Annie L
Purchase Details
Closed on
Apr 6, 2006
Sold by
Christopher Sam E and Christopher Alice M
Bought by
Bradley Michael V and Bradley Annie L
Home Financials for this Owner
Home Financials are based on the most recent Mortgage that was taken out on this home.
Original Mortgage
$185,600
Interest Rate
6.37%
Mortgage Type
Fannie Mae Freddie Mac
Create a Home Valuation Report for This Property
The Home Valuation Report is an in-depth analysis detailing your home's value as well as a comparison with similar homes in the area
Home Values in the Area
Average Home Value in this Area
Purchase History
| Date | Buyer | Sale Price | Title Company |
|---|---|---|---|
| Griggs Kisha L | $170,000 | Pntn | |
| Bradley Michael V | -- | None Available | |
| Bradley Michael V | $232,000 | Multiple |
Source: Public Records
Mortgage History
| Date | Status | Borrower | Loan Amount |
|---|---|---|---|
| Open | Griggs Kisha L | $136,000 | |
| Previous Owner | Bradley Michael V | $185,600 |
Source: Public Records
Tax History
| Year | Tax Paid | Tax Assessment Tax Assessment Total Assessment is a certain percentage of the fair market value that is determined by local assessors to be the total taxable value of land and additions on the property. | Land | Improvement |
|---|---|---|---|---|
| 2025 | $9,436 | $25,000 | $8,500 | $16,500 |
| 2024 | $9,436 | $25,000 | $8,500 | $16,500 |
| 2023 | $9,606 | $25,000 | $8,500 | $16,500 |
| 2022 | $9,606 | $20,335 | $7,500 | $12,835 |
| 2021 | $9,583 | $20,334 | $7,500 | $12,834 |
| 2020 | $8,877 | $20,334 | $7,500 | $12,834 |
| 2019 | $7,614 | $17,960 | $7,000 | $10,960 |
| 2018 | $7,558 | $17,960 | $7,000 | $10,960 |
| 2017 | $7,336 | $17,960 | $7,000 | $10,960 |
| 2016 | $7,031 | $16,499 | $6,500 | $9,999 |
| 2015 | $6,946 | $16,499 | $6,500 | $9,999 |
| 2014 | $6,815 | $16,499 | $6,500 | $9,999 |
| 2013 | $6,798 | $17,862 | $6,500 | $11,362 |
Source: Public Records
Map
Nearby Homes
- 831 Violet Ln
- 20920 Governors Hwy
- 4110 Applewood Ln
- 20535 Marathon Ct
- 21142 Locust St
- 4325 Oakwood Ln
- 4141 204th St
- 722 Kostner Ave
- 20436 Arcadian Dr
- 20415 Doria Ln
- 3919 214th St
- 21406 S Jean Ave
- 3506 Ithaca Rd
- 3451 Ithaca Rd
- 820 School Ave
- 3727 214th Place Unit 2
- 620 Larkspur Ln
- 3133 Nottingham Ct
- 3135 Nottingham Ct
- 3704 215th St Unit 105
- 801 Cumnock Rd
- 795 Cumnock Rd
- 832 Exmoor Rd
- 805 Exmoor Rd
- 828 Exmoor Rd
- 800 Cumnock Rd
- 838 Highview Ave
- 824 Exmoor Rd
- 789 Cumnock Rd
- 792 Cumnock Rd
- 893 Woodstock Rd
- 801 Exmoor Rd
- 820 Exmoor Rd
- 839 Highview Ave
- 785 Cumnock Rd
- 793 Exmoor Rd
- 897 Woodstock Rd
- 889 Woodstock Rd
- 784 Cumnock Rd
- 785 Exmoor Rd
Your Personal Tour Guide
Ask me questions while you tour the home.