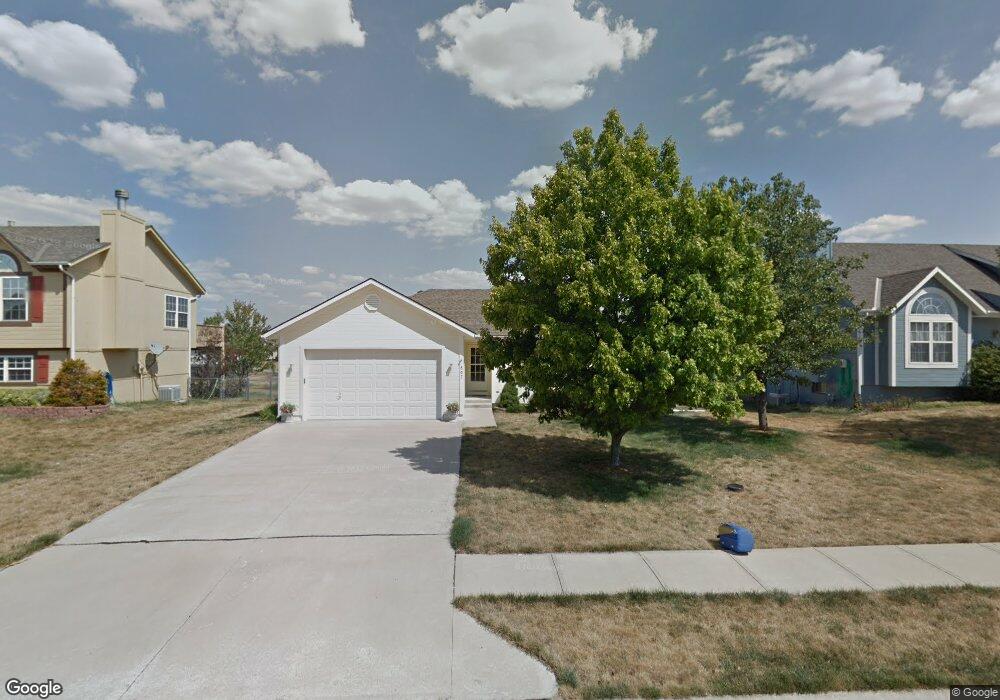
807 Furlong Dr Raymore, MO 64083
Estimated Value: $296,000 - $343,000
3
Beds
2
Baths
1,291
Sq Ft
$244/Sq Ft
Est. Value
About This Home
This home is located at 807 Furlong Dr, Raymore, MO 64083 and is currently estimated at $315,565, approximately $244 per square foot. 807 Furlong Dr is a home located in Cass County with nearby schools including Raymore Elementary School, Raymore-Peculiar East Middle School, and Raymore-Peculiar Senior High School.
Ownership History
Date
Name
Owned For
Owner Type
Purchase Details
Closed on
Nov 5, 2020
Sold by
Sullivan Troy E and Sullivan Susan K
Bought by
Sykes Jeremy Ty
Current Estimated Value
Home Financials for this Owner
Home Financials are based on the most recent Mortgage that was taken out on this home.
Original Mortgage
$150,000
Outstanding Balance
$132,868
Interest Rate
2.8%
Mortgage Type
New Conventional
Estimated Equity
$182,697
Create a Home Valuation Report for This Property
The Home Valuation Report is an in-depth analysis detailing your home's value as well as a comparison with similar homes in the area
Home Values in the Area
Average Home Value in this Area
Purchase History
| Date | Buyer | Sale Price | Title Company |
|---|---|---|---|
| Sykes Jeremy Ty | -- | Coffelt Land Title Inc |
Source: Public Records
Mortgage History
| Date | Status | Borrower | Loan Amount |
|---|---|---|---|
| Open | Sykes Jeremy Ty | $150,000 |
Source: Public Records
Tax History
| Year | Tax Paid | Tax Assessment Tax Assessment Total Assessment is a certain percentage of the fair market value that is determined by local assessors to be the total taxable value of land and additions on the property. | Land | Improvement |
|---|---|---|---|---|
| 2025 | $2,780 | $38,210 | $6,370 | $31,840 |
| 2024 | $2,780 | $34,160 | $5,790 | $28,370 |
| 2023 | $2,776 | $34,160 | $5,790 | $28,370 |
| 2022 | $2,502 | $30,580 | $5,790 | $24,790 |
| 2021 | $2,502 | $30,580 | $5,790 | $24,790 |
| 2020 | $2,458 | $29,510 | $5,790 | $23,720 |
| 2019 | $2,373 | $29,510 | $5,790 | $23,720 |
| 2018 | $2,138 | $25,670 | $4,820 | $20,850 |
| 2017 | $1,959 | $25,670 | $4,820 | $20,850 |
| 2016 | $1,959 | $24,420 | $4,820 | $19,600 |
| 2015 | $1,960 | $24,420 | $4,820 | $19,600 |
| 2014 | $1,950 | $24,280 | $4,820 | $19,460 |
| 2013 | -- | $24,280 | $4,820 | $19,460 |
Source: Public Records
Map
Nearby Homes
- 709 Derby St
- 804 S Washington St
- 713 S Sunset Ln
- 814 Coventry Ln
- 605 S Franklin St
- 1024 S Madison St
- 817 Clancy Ct
- 506 S Adams St
- 600 W Buena Vista Dr
- 727 Country Ln
- 901 W Lucy Webb Rd
- 503 S Harrison Ave
- 720 Sandpiper St
- 405 S Monroe St
- 1105 Creekside Ct
- 1103 Carlisle Dr
- 1108 Yokley Dr
- 211 S Franklin St
- 305 E Olive St
- 528 S Saturn Dr
Your Personal Tour Guide
Ask me questions while you tour the home.