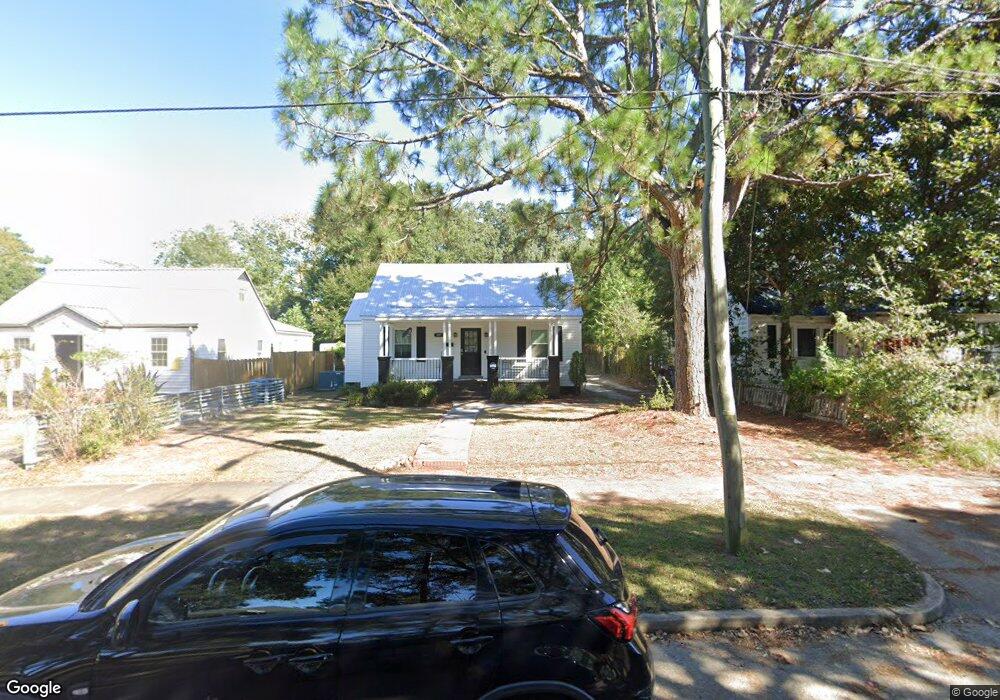
807 S 15th St Wilmington, NC 28401
Dry Pond-South Side NeighborhoodEstimated Value: $317,001 - $389,000
2
Beds
1
Bath
981
Sq Ft
$356/Sq Ft
Est. Value
About This Home
This home is located at 807 S 15th St, Wilmington, NC 28401 and is currently estimated at $349,000, approximately $355 per square foot. 807 S 15th St is a home located in New Hanover County with nearby schools including Forest Hills Global Elementary School, Williston Middle School, and John T. Hoggard High School.
Ownership History
Date
Name
Owned For
Owner Type
Purchase Details
Closed on
Mar 5, 2020
Sold by
Cockerham Terry Anne Ward and Terry Anne Ward Cockerham 2001
Bought by
Cockerham Haven Earl
Current Estimated Value
Purchase Details
Closed on
Feb 25, 2002
Sold by
Cockerham Haven Terry W
Bought by
Cockerham Terry Ann Ward Trust
Purchase Details
Closed on
Jan 31, 1991
Sold by
Waddell Ruth
Bought by
Cockerham Terry
Purchase Details
Closed on
Nov 1, 1981
Bought by
Waddell Alonza
Create a Home Valuation Report for This Property
The Home Valuation Report is an in-depth analysis detailing your home's value as well as a comparison with similar homes in the area
Home Values in the Area
Average Home Value in this Area
Purchase History
| Date | Buyer | Sale Price | Title Company |
|---|---|---|---|
| Cockerham Haven Earl | -- | None Available | |
| Cockerham Terry Ann Ward Trust | -- | -- | |
| Cockerham Terry | -- | -- | |
| Waddell Alonza | -- | -- |
Source: Public Records
Tax History Compared to Growth
Tax History
| Year | Tax Paid | Tax Assessment Tax Assessment Total Assessment is a certain percentage of the fair market value that is determined by local assessors to be the total taxable value of land and additions on the property. | Land | Improvement |
|---|---|---|---|---|
| 2025 | $2,107 | $358,000 | $76,700 | $281,300 |
| 2023 | $1,545 | $177,600 | $55,800 | $121,800 |
| 2022 | $1,167 | $177,600 | $55,800 | $121,800 |
| 2021 | $1,167 | $181,800 | $55,800 | $126,000 |
| 2020 | $868 | $82,400 | $13,300 | $69,100 |
| 2019 | $868 | $82,400 | $13,300 | $69,100 |
| 2018 | $868 | $82,400 | $13,300 | $69,100 |
| 2017 | $868 | $82,400 | $13,300 | $69,100 |
| 2016 | $776 | $70,000 | $25,100 | $44,900 |
| 2015 | $741 | $70,000 | $25,100 | $44,900 |
| 2014 | $710 | $70,000 | $25,100 | $44,900 |
Source: Public Records
Map
Nearby Homes