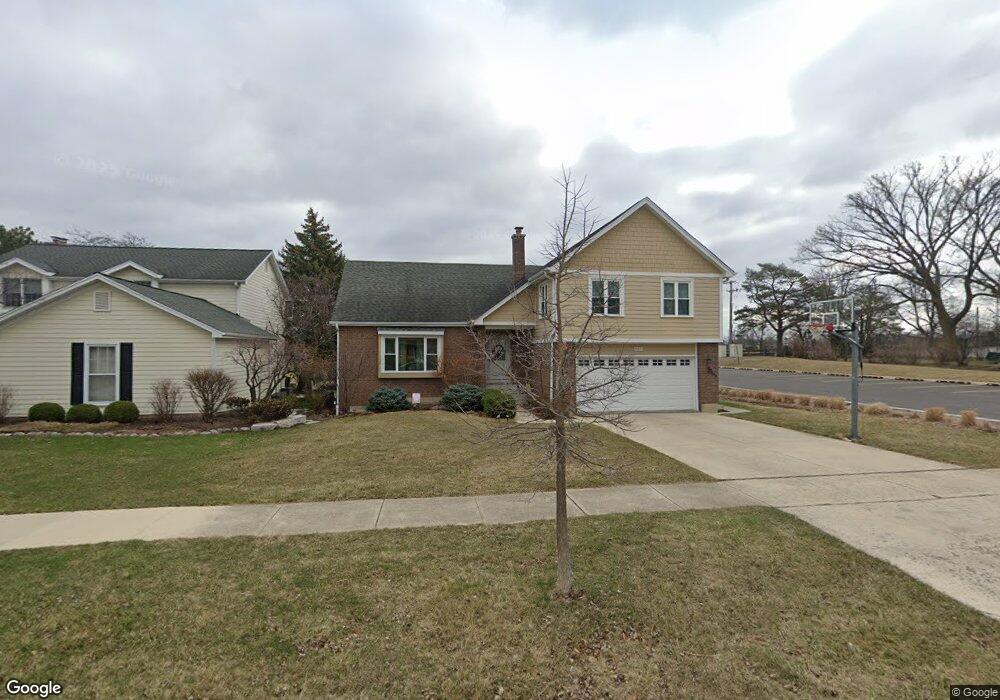
807 S Linden Ave Elmhurst, IL 60126
Estimated Value: $724,000 - $883,000
--
Bed
--
Bath
2,498
Sq Ft
$327/Sq Ft
Est. Value
About This Home
This home is located at 807 S Linden Ave, Elmhurst, IL 60126 and is currently estimated at $816,925, approximately $327 per square foot. 807 S Linden Ave is a home located in DuPage County with nearby schools including Pulaski Intl School of Chicago, Jefferson Elementary School, and Bryan Middle School.
Ownership History
Date
Name
Owned For
Owner Type
Purchase Details
Closed on
Apr 5, 2008
Sold by
Berger Robert P and Berger Paula M
Bought by
Berger Robert P and Berger Paula M
Current Estimated Value
Purchase Details
Closed on
Aug 9, 2002
Sold by
Gorman Trent and Gorman Denean
Bought by
Berger Robert P and Berger Paula M
Home Financials for this Owner
Home Financials are based on the most recent Mortgage that was taken out on this home.
Original Mortgage
$300,000
Outstanding Balance
$127,036
Interest Rate
6.56%
Mortgage Type
Purchase Money Mortgage
Estimated Equity
$689,889
Purchase Details
Closed on
Jun 26, 1996
Sold by
Debiase Patricia Ann
Bought by
Gorman Trent and Gorman Denean
Home Financials for this Owner
Home Financials are based on the most recent Mortgage that was taken out on this home.
Original Mortgage
$200,000
Interest Rate
8.09%
Mortgage Type
Purchase Money Mortgage
Create a Home Valuation Report for This Property
The Home Valuation Report is an in-depth analysis detailing your home's value as well as a comparison with similar homes in the area
Home Values in the Area
Average Home Value in this Area
Purchase History
| Date | Buyer | Sale Price | Title Company |
|---|---|---|---|
| Berger Robert P | -- | None Available | |
| Berger Robert P | $393,000 | -- | |
| Gorman Trent | $270,000 | Attorneys Title Guaranty Fun |
Source: Public Records
Mortgage History
| Date | Status | Borrower | Loan Amount |
|---|---|---|---|
| Open | Berger Robert P | $300,000 | |
| Previous Owner | Gorman Trent | $200,000 |
Source: Public Records
Tax History Compared to Growth
Tax History
| Year | Tax Paid | Tax Assessment Tax Assessment Total Assessment is a certain percentage of the fair market value that is determined by local assessors to be the total taxable value of land and additions on the property. | Land | Improvement |
|---|---|---|---|---|
| 2024 | $13,871 | $238,167 | $105,685 | $132,482 |
| 2023 | $12,885 | $220,240 | $97,730 | $122,510 |
| 2022 | $12,475 | $211,730 | $93,960 | $117,770 |
| 2021 | $12,168 | $206,460 | $91,620 | $114,840 |
| 2020 | $11,699 | $201,930 | $89,610 | $112,320 |
| 2019 | $11,456 | $191,990 | $85,200 | $106,790 |
| 2018 | $10,739 | $179,340 | $80,650 | $98,690 |
| 2017 | $10,506 | $170,890 | $76,850 | $94,040 |
| 2016 | $10,288 | $160,990 | $72,400 | $88,590 |
| 2015 | $10,190 | $149,980 | $67,450 | $82,530 |
| 2014 | $10,035 | $136,220 | $53,540 | $82,680 |
| 2013 | $9,925 | $138,130 | $54,290 | $83,840 |
Source: Public Records
Map
Nearby Homes
- 341 E Madison St
- 427 E Adams St
- 441 E Adams St
- 353 E Butterfield Rd
- 900 S Colfax Ave
- 705 S Edgewood Ave
- 522 E Park Manor Ct
- 274 E Crescent Ave
- 494 E Atwood Ct
- 675 S Edgewood Ave
- 185 E Oneida Ave
- 505 E Atwood Ct
- 426 E Harrison St
- 613 S Chatham Ave
- 162 E Hale St
- 15W320 Concord St
- 593 S Edgewood Ave
- 562 S Poplar Ave
- 550 S Hillcrest Ave
- 694 S York St
- 803 S Linden Ave
- 799 S Linden Ave
- 821 S Linden Ave
- 795 S Linden Ave
- 808 S Linden Ave
- 827 S Linden Ave
- 802 S Linden Ave
- 812 S Linden Ave
- 798 S Linden Ave
- 791 S Linden Ave
- 794 S Linden Ave
- 820 S Linden Ave
- 833 S Linden Ave
- 790 S Linden Ave
- 785 S Linden Ave
- 828 S Linden Ave
- 837 S Linden Ave
- 807 S Poplar Ave
- 815 S Poplar Ave
- 803 S Poplar Ave