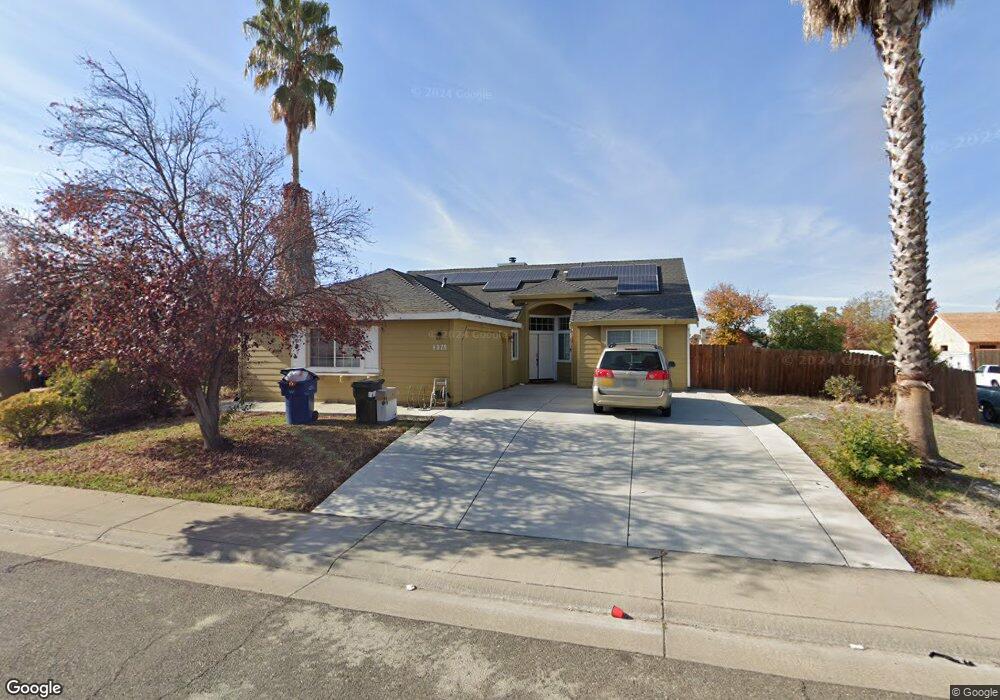
8070 Lexus Way Sacramento, CA 95828
Estimated Value: $459,650 - $518,000
3
Beds
2
Baths
1,495
Sq Ft
$330/Sq Ft
Est. Value
About This Home
This home is located at 8070 Lexus Way, Sacramento, CA 95828 and is currently estimated at $493,413, approximately $330 per square foot. 8070 Lexus Way is a home located in Sacramento County with nearby schools including Isabelle Jackson Elementary School, James Rutter Middle School, and Florin High School.
Ownership History
Date
Name
Owned For
Owner Type
Purchase Details
Closed on
Jun 15, 2016
Sold by
Nguyen Niem and Phan Hong
Bought by
Nguyen Niem Tien and Phan Hong Cam
Current Estimated Value
Home Financials for this Owner
Home Financials are based on the most recent Mortgage that was taken out on this home.
Original Mortgage
$170,000
Outstanding Balance
$135,301
Interest Rate
3.57%
Mortgage Type
New Conventional
Estimated Equity
$358,112
Purchase Details
Closed on
Oct 6, 2011
Sold by
Chiu Sin Chat and Chung Ying
Bought by
Nguyen Niem and Phan Hong
Home Financials for this Owner
Home Financials are based on the most recent Mortgage that was taken out on this home.
Original Mortgage
$141,324
Interest Rate
4.25%
Mortgage Type
FHA
Purchase Details
Closed on
Jan 22, 1997
Sold by
Parkcrest Development Corp
Bought by
Chiu Sin Chat and Chung Ying
Home Financials for this Owner
Home Financials are based on the most recent Mortgage that was taken out on this home.
Original Mortgage
$99,400
Interest Rate
7.74%
Create a Home Valuation Report for This Property
The Home Valuation Report is an in-depth analysis detailing your home's value as well as a comparison with similar homes in the area
Home Values in the Area
Average Home Value in this Area
Purchase History
| Date | Buyer | Sale Price | Title Company |
|---|---|---|---|
| Nguyen Niem Tien | -- | North American Title Co Inc | |
| Nguyen Niem | $145,000 | Fidelity National Title Comp | |
| Chiu Sin Chat | $142,000 | Chicago Title Co |
Source: Public Records
Mortgage History
| Date | Status | Borrower | Loan Amount |
|---|---|---|---|
| Open | Nguyen Niem Tien | $170,000 | |
| Closed | Nguyen Niem | $141,324 | |
| Previous Owner | Chiu Sin Chat | $99,400 |
Source: Public Records
Tax History Compared to Growth
Tax History
| Year | Tax Paid | Tax Assessment Tax Assessment Total Assessment is a certain percentage of the fair market value that is determined by local assessors to be the total taxable value of land and additions on the property. | Land | Improvement |
|---|---|---|---|---|
| 2025 | $2,151 | $182,116 | $37,676 | $144,440 |
| 2024 | $2,151 | $178,546 | $36,938 | $141,608 |
| 2023 | $2,101 | $175,046 | $36,214 | $138,832 |
| 2022 | $2,069 | $171,614 | $35,504 | $136,110 |
| 2021 | $2,048 | $168,250 | $34,808 | $133,442 |
| 2020 | $2,023 | $166,526 | $34,452 | $132,074 |
| 2019 | $1,989 | $163,262 | $33,777 | $129,485 |
| 2018 | $1,940 | $160,062 | $33,115 | $126,947 |
| 2017 | $1,910 | $156,924 | $32,466 | $124,458 |
| 2016 | $1,822 | $153,848 | $31,830 | $122,018 |
| 2015 | $1,791 | $151,538 | $31,352 | $120,186 |
| 2014 | $1,764 | $148,570 | $30,738 | $117,832 |
Source: Public Records
Map
Nearby Homes
- 8186 Gustine Way
- 8336 Cutler Way
- 7905 Springarden Way
- 8346 Floxtree Ct
- 8077 Goran Ct
- 8012 Northern Oak Cir
- 8437 Yermo Way
- 8317 Honeycomb Way
- 8266 Summer Sunset Dr
- 8016 Stevenson Ave
- 8282 Union Creek Way
- 8336 Summer Sunset Dr
- 7901 Stevenson Ave
- 4.13 ACR Lenhart Rd
- 8095 E Stockton Blvd
- 8510 Cavendish Way
- 8205 Weyburn Ct
- 8233 Short Rd
- 7711 Lenhart Rd
- 8216 Exbourne Cir
- 8076 Lexus Way
- 8278 Golden Park Ct
- 8274 Golden Park Ct
- 8071 Lexus Way
- 8075 Lexus Way
- 8067 Lexus Way
- 8082 Lexus Way
- 8269 Cliffe Way
- 8079 Lexus Way
- 8266 Stevenson Ave
- 8063 Lexus Way
- 8263 Cliffe Way
- 8260 Stevenson Ave
- 8083 Lexus Way
- 8059 Lexus Way
- 8073 Encomium Ct
- 8069 Encomium Ct
- 8077 Encomium Ct
- 8081 Encomium Ct
- 8055 Lexus Way