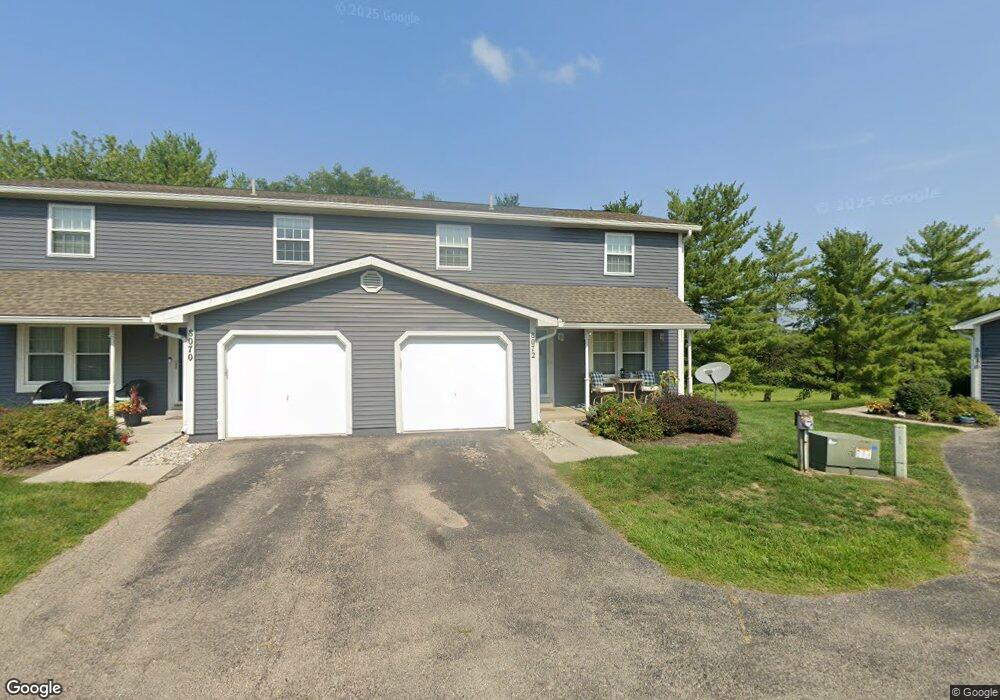
8072 Halyard Ct Unit 12 Maineville, OH 45039
Landen NeighborhoodEstimated Value: $209,000 - $240,584
3
Beds
3
Baths
2,118
Sq Ft
$107/Sq Ft
Est. Value
About This Home
This home is located at 8072 Halyard Ct Unit 12, Maineville, OH 45039 and is currently estimated at $227,146, approximately $107 per square foot. 8072 Halyard Ct Unit 12 is a home located in Warren County with nearby schools including Kings Junior High School, Kings High School, and St. Margaret of York School.
Ownership History
Date
Name
Owned For
Owner Type
Purchase Details
Closed on
Jun 9, 2017
Sold by
Carroll Daniel P and Carroll Robin
Bought by
Dilts Mark A and Dwyer Mary C
Current Estimated Value
Purchase Details
Closed on
Mar 23, 2005
Sold by
Kahn Andrew H and Kahn Julie D
Bought by
Carroll Daniel P
Home Financials for this Owner
Home Financials are based on the most recent Mortgage that was taken out on this home.
Original Mortgage
$104,880
Interest Rate
5.61%
Mortgage Type
Fannie Mae Freddie Mac
Purchase Details
Closed on
Feb 22, 2001
Sold by
Dean Chauncey
Bought by
Kahn Andrew H
Home Financials for this Owner
Home Financials are based on the most recent Mortgage that was taken out on this home.
Original Mortgage
$74,800
Interest Rate
6.91%
Mortgage Type
New Conventional
Purchase Details
Closed on
May 17, 1984
Sold by
Harborridge Assoc
Bought by
Dean and Dean Chauncey H
Purchase Details
Closed on
May 7, 1984
Sold by
Harborridge Assoc
Bought by
Harborridge Assoc
Create a Home Valuation Report for This Property
The Home Valuation Report is an in-depth analysis detailing your home's value as well as a comparison with similar homes in the area
Home Values in the Area
Average Home Value in this Area
Purchase History
| Date | Buyer | Sale Price | Title Company |
|---|---|---|---|
| Dilts Mark A | $114,500 | None Available | |
| Carroll Daniel P | $110,400 | Old National Title | |
| Kahn Andrew H | $93,500 | -- | |
| Dean | $173,800 | -- | |
| Harborridge Assoc | -- | -- |
Source: Public Records
Mortgage History
| Date | Status | Borrower | Loan Amount |
|---|---|---|---|
| Previous Owner | Carroll Daniel P | $104,880 | |
| Previous Owner | Kahn Andrew H | $74,800 |
Source: Public Records
Tax History Compared to Growth
Tax History
| Year | Tax Paid | Tax Assessment Tax Assessment Total Assessment is a certain percentage of the fair market value that is determined by local assessors to be the total taxable value of land and additions on the property. | Land | Improvement |
|---|---|---|---|---|
| 2024 | $3,311 | $62,800 | $14,000 | $48,800 |
| 2023 | $2,749 | $46,760 | $4,235 | $42,525 |
| 2022 | $2,706 | $46,760 | $4,235 | $42,525 |
| 2021 | $2,269 | $46,760 | $4,235 | $42,525 |
| 2020 | $2,228 | $38,644 | $3,500 | $35,144 |
| 2019 | $2,258 | $38,644 | $3,500 | $35,144 |
| 2018 | $2,265 | $38,644 | $3,500 | $35,144 |
| 2017 | $2,121 | $32,298 | $3,157 | $29,141 |
| 2016 | $2,176 | $32,298 | $3,157 | $29,141 |
| 2015 | $1,985 | $32,298 | $3,157 | $29,141 |
| 2014 | $1,371 | $20,970 | $3,160 | $17,810 |
| 2013 | $1,373 | $23,230 | $3,500 | $19,730 |
Source: Public Records
Map
Nearby Homes
- 2675 Carriagegate Ln
- 7881 Hackney Cir
- 8309 Marigold Ln
- 2429 Candlemakers Ln
- 4000 Orchard Ln
- 8305 Woodbridge Ln
- 8480 Island Pines Place
- 8508 Southland Dr
- 7629 Watercrest Ct
- 3444 Cutter Ln
- 3110 Grand Falls Blvd
- 3224 Grand Falls Blvd Unit D
- 7826 Columbia Rd
- 2839 Mossy Brink Ct
- 8740 Exeter Place
- 8026 River Vista Ct
- 8020 River Vista Ct
- 2877 Mossy Brink Ct Unit 70
- 2954 Mossy Brink Ct Unit 40
- 2627 Hollyhock Rd
- 8070 Halyard Ct Unit 11
- 8080 Halyard Ct
- 8082 Halyard Ct
- 8068 Halyard Ct Unit 10
- 8084 Halyard Ct Unit 515
- 8066 Halyard Ct
- 8086 Halyard Ct
- 8056 Halyard Ct
- 8054 Halyard Ct
- 2737 N Harbor Dr
- 8052 Halyard Ct
- 8100 Halyard Ct
- 2735 N Harbor Dr Unit 23
- 8102 Halyard Ct
- 8050 Halyard Ct
- 2741 N Harbor Dr Unit 25
- 2733 N Harbor Dr
- 2731 N Harbor Dr Unit 21
- 2743 N Harbor Dr Unit 26
- 8104 Halyard Ct