8074 S Michele Ln Tempe, AZ 85284
South Tempe NeighborhoodEstimated Value: $916,738 - $1,092,000
Studio
3
Baths
2,588
Sq Ft
$394/Sq Ft
Est. Value
About This Home
This home is located at 8074 S Michele Ln, Tempe, AZ 85284 and is currently estimated at $1,018,935, approximately $393 per square foot. 8074 S Michele Ln is a home located in Maricopa County with nearby schools including C I Waggoner School, Kyrene Middle School, and Mountain Pointe High School.
Ownership History
Date
Name
Owned For
Owner Type
Purchase Details
Closed on
Sep 12, 2003
Sold by
Simmons Jr James Grady and Simmons Peggie J
Bought by
Simmons James Grady and Simmons Living Trust
Current Estimated Value
Purchase Details
Closed on
Feb 9, 1998
Sold by
Fulton Homes Sales Corp
Bought by
Simmons Jr James Grady and Simmons Peggie J
Home Financials for this Owner
Home Financials are based on the most recent Mortgage that was taken out on this home.
Original Mortgage
$291,050
Outstanding Balance
$51,387
Interest Rate
6.97%
Mortgage Type
New Conventional
Estimated Equity
$967,548
Purchase Details
Closed on
Feb 6, 1998
Sold by
Security Title Agency
Bought by
Fulton Homes Corp
Home Financials for this Owner
Home Financials are based on the most recent Mortgage that was taken out on this home.
Original Mortgage
$291,050
Outstanding Balance
$51,387
Interest Rate
6.97%
Mortgage Type
New Conventional
Estimated Equity
$967,548
Create a Home Valuation Report for This Property
The Home Valuation Report is an in-depth analysis detailing your home's value as well as a comparison with similar homes in the area
Home Values in the Area
Average Home Value in this Area
Purchase History
| Date | Buyer | Sale Price | Title Company |
|---|---|---|---|
| Simmons James Grady | -- | -- | |
| Simmons Jr James Grady | $363,871 | Security Title Agency | |
| Fulton Homes Sales Corp | $44,729 | Security Title Agency | |
| Fulton Homes Corp | -- | Security Title Agency |
Source: Public Records
Mortgage History
| Date | Status | Borrower | Loan Amount |
|---|---|---|---|
| Open | Simmons Jr James Grady | $291,050 |
Source: Public Records
Tax History
| Year | Tax Paid | Tax Assessment Tax Assessment Total Assessment is a certain percentage of the fair market value that is determined by local assessors to be the total taxable value of land and additions on the property. | Land | Improvement |
|---|---|---|---|---|
| 2025 | $6,439 | $64,549 | -- | -- |
| 2024 | $6,056 | $61,475 | -- | -- |
| 2023 | $6,056 | $70,610 | $14,120 | $56,490 |
| 2022 | $5,747 | $55,760 | $11,150 | $44,610 |
| 2021 | $5,902 | $53,210 | $10,640 | $42,570 |
| 2020 | $5,768 | $52,470 | $10,490 | $41,980 |
| 2019 | $5,579 | $52,530 | $10,500 | $42,030 |
| 2018 | $5,391 | $49,520 | $9,900 | $39,620 |
| 2017 | $5,161 | $49,210 | $9,840 | $39,370 |
| 2016 | $5,212 | $53,180 | $10,630 | $42,550 |
| 2015 | $4,760 | $42,970 | $8,590 | $34,380 |
Source: Public Records
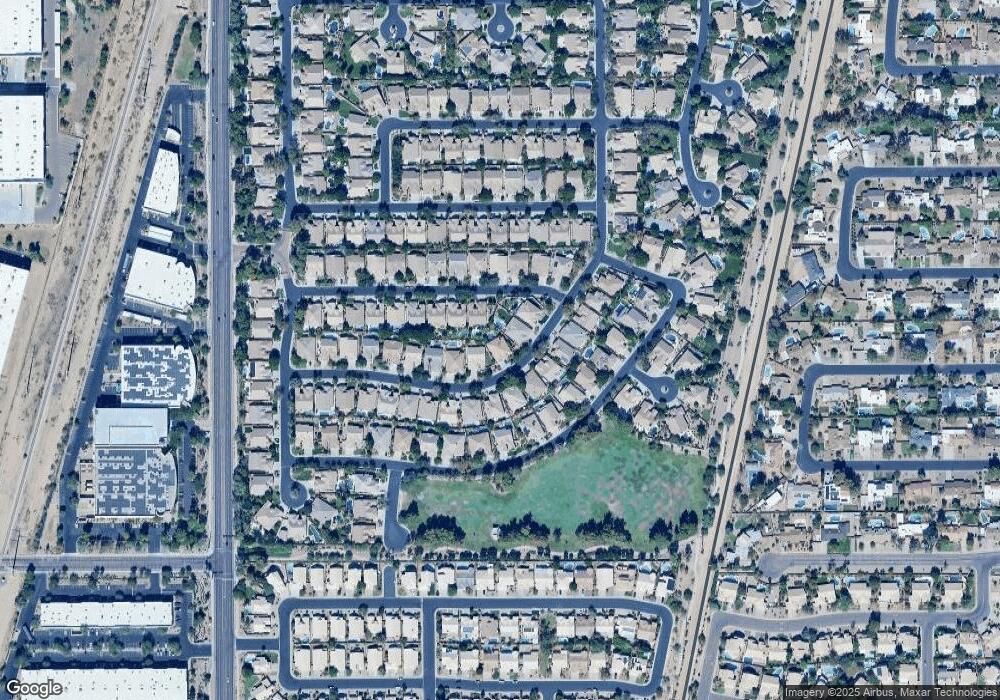
Map
Nearby Homes
- 7880 S Michele Ln
- 7879 S Stephanie Ln
- 273 W Pecan Place
- 8274 S Stephanie Ln
- 127 W Buena Vista Dr
- 319 W Bolero Dr
- 201 E Citation Ln
- 8204 S Homestead Ln
- 317 W Calle Monte Vista
- 8351 S Homestead Ln
- 563 E Krista Way
- 82 W Calle de Arcos
- 91 W Calle de Arcos
- 83 W Calle de Arcos
- 11812 S 71st St
- 8859 S Grandview Dr
- 40 W Sarah Ln
- 790 E Sunburst Ln
- 57 E Ranch Rd Unit II
- 211 E Rhea Rd
- 8062 S Michele Ln
- 356 W Secretariat Dr
- 355 W Knight Ln
- 8050 S Michele Ln
- 364 W Secretariat Dr
- 363 W Knight Ln
- 8075 S Michele Ln
- 341 W Secretariat Dr
- 8063 S Michele Ln
- 349 W Secretariat Dr
- 8051 S Michele Ln
- 357 W Secretariat Dr
- 371 W Knight Ln
- 372 W Secretariat Dr
- 8039 S Michele Ln
- 346 W Knight Ln
- 365 W Secretariat Dr
- 338 W Knight Ln
- 354 W Knight Ln
- 8090 S Dateland Dr
Your Personal Tour Guide
Ask me questions while you tour the home.