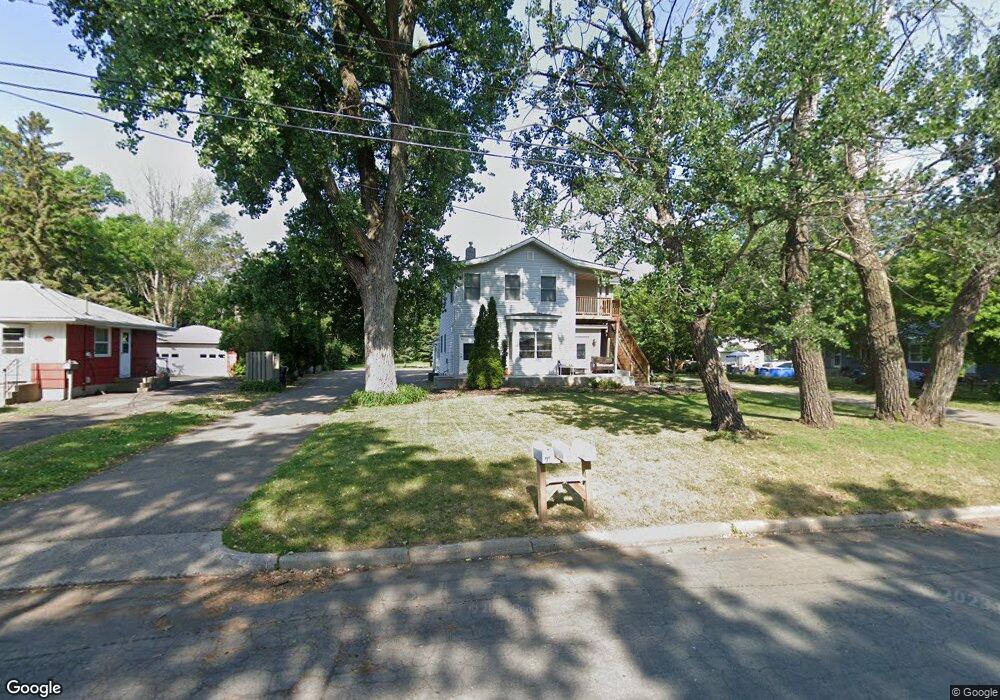
808 2nd St Unit 1 - 3 Farmington, MN 55024
Estimated Value: $358,000 - $407,000
2
Beds
1
Bath
960
Sq Ft
$394/Sq Ft
Est. Value
About This Home
This home is located at 808 2nd St Unit 1 - 3, Farmington, MN 55024 and is currently estimated at $378,643, approximately $394 per square foot. 808 2nd St Unit 1 - 3 is a home located in Dakota County with nearby schools including Farmington Elementary School, Robert Boeckman Middle School, and Farmington High School.
Ownership History
Date
Name
Owned For
Owner Type
Purchase Details
Closed on
Sep 11, 2019
Sold by
Mullen Benton Amy E
Bought by
Olson Property Investments Llc
Current Estimated Value
Home Financials for this Owner
Home Financials are based on the most recent Mortgage that was taken out on this home.
Original Mortgage
$218,000
Interest Rate
3.5%
Mortgage Type
Purchase Money Mortgage
Purchase Details
Closed on
May 1, 2014
Sold by
Bischel Sperling Llc
Bought by
Mullen Benton Amy E and Benton Peter F
Home Financials for this Owner
Home Financials are based on the most recent Mortgage that was taken out on this home.
Original Mortgage
$270,000
Interest Rate
4.41%
Mortgage Type
Future Advance Clause Open End Mortgage
Purchase Details
Closed on
Aug 17, 2004
Sold by
Grundman Mark H and Grundman Robin A
Bought by
Bischel Spering Llc
Create a Home Valuation Report for This Property
The Home Valuation Report is an in-depth analysis detailing your home's value as well as a comparison with similar homes in the area
Home Values in the Area
Average Home Value in this Area
Purchase History
| Date | Buyer | Sale Price | Title Company |
|---|---|---|---|
| Olson Property Investments Llc | $272,500 | Edina Realty Title Inc | |
| Mullen Benton Amy E | $250,000 | None Available | |
| Bischel Spering Llc | $165,000 | -- |
Source: Public Records
Mortgage History
| Date | Status | Borrower | Loan Amount |
|---|---|---|---|
| Previous Owner | Olson Property Investments Llc | $218,000 | |
| Previous Owner | Mullen Benton Amy E | $270,000 |
Source: Public Records
Tax History Compared to Growth
Tax History
| Year | Tax Paid | Tax Assessment Tax Assessment Total Assessment is a certain percentage of the fair market value that is determined by local assessors to be the total taxable value of land and additions on the property. | Land | Improvement |
|---|---|---|---|---|
| 2024 | $5,356 | $357,800 | $92,200 | $265,600 |
| 2023 | $5,356 | $363,500 | $92,400 | $271,100 |
| 2022 | $5,050 | $342,700 | $92,100 | $250,600 |
| 2021 | $5,174 | $290,500 | $80,100 | $210,400 |
| 2020 | $3,726 | $295,200 | $76,300 | $218,900 |
| 2019 | $6,017 | $258,300 | $72,700 | $185,600 |
| 2018 | $5,388 | $237,900 | $69,200 | $168,700 |
| 2017 | $4,787 | $223,300 | $65,900 | $157,400 |
| 2016 | $4,907 | $216,400 | $60,600 | $155,800 |
| 2015 | $3,893 | $236,700 | $60,600 | $176,100 |
| 2014 | -- | $195,500 | $56,400 | $139,100 |
| 2013 | -- | $189,100 | $50,700 | $138,400 |
Source: Public Records
Map
Nearby Homes