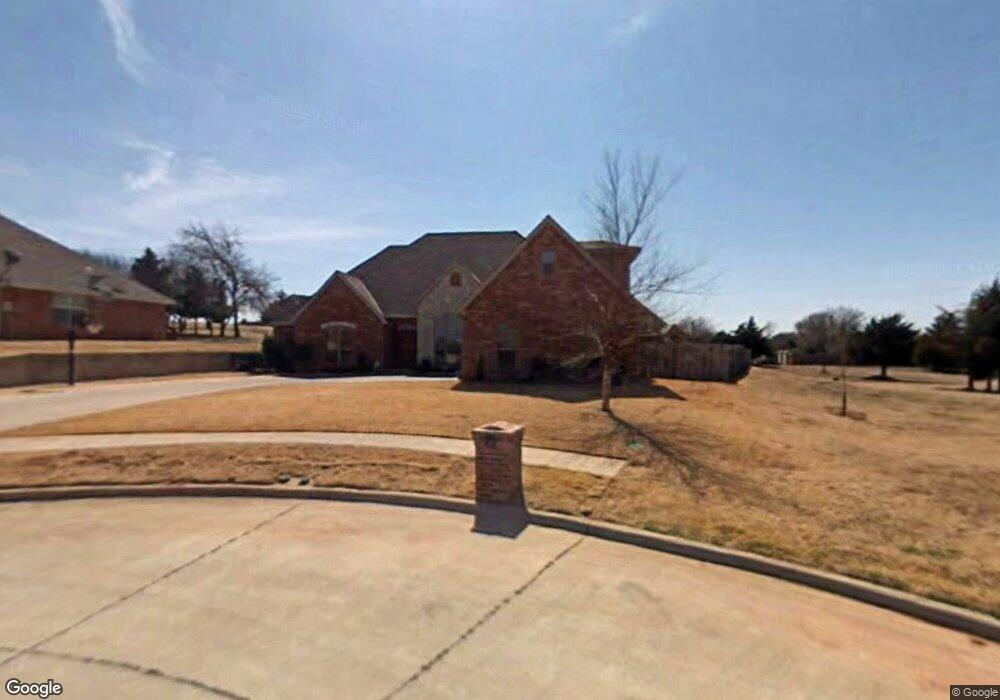
808 Carrie Ct Purcell, OK 73080
Estimated Value: $350,893 - $450,000
3
Beds
2
Baths
2,793
Sq Ft
$144/Sq Ft
Est. Value
About This Home
This home is located at 808 Carrie Ct, Purcell, OK 73080 and is currently estimated at $403,473, approximately $144 per square foot. 808 Carrie Ct is a home located in McClain County with nearby schools including Purcell Elementary School, Purcell Intermediate School, and Purcell Junior High School.
Ownership History
Date
Name
Owned For
Owner Type
Purchase Details
Closed on
Jun 22, 2022
Sold by
Dean Scott Clifford and Dean Anita
Bought by
Deanita Living Trust
Current Estimated Value
Purchase Details
Closed on
Sep 4, 2019
Sold by
Hamilton Matthew W and Hamilton Joni G
Bought by
Dean Scott Clifford and Scott Anita
Purchase Details
Closed on
Sep 19, 2006
Sold by
Ridgway Dustin E and Ridgway Audrey N
Bought by
Hamilton Matthew W and Hamilton Joni G
Home Financials for this Owner
Home Financials are based on the most recent Mortgage that was taken out on this home.
Original Mortgage
$175,000
Interest Rate
6.47%
Mortgage Type
New Conventional
Purchase Details
Closed on
Aug 26, 2002
Sold by
The Cliffs Group Llc
Bought by
Ridgway Dustin and Ridgway Audrey
Create a Home Valuation Report for This Property
The Home Valuation Report is an in-depth analysis detailing your home's value as well as a comparison with similar homes in the area
Home Values in the Area
Average Home Value in this Area
Purchase History
| Date | Buyer | Sale Price | Title Company |
|---|---|---|---|
| Deanita Living Trust | -- | Hobbs Britton L | |
| Dean Scott Clifford | $268,000 | American Abstract Company | |
| Hamilton Matthew W | $219,000 | None Available | |
| Ridgway Dustin | $25,000 | -- |
Source: Public Records
Mortgage History
| Date | Status | Borrower | Loan Amount |
|---|---|---|---|
| Previous Owner | Hamilton Matthew W | $175,000 |
Source: Public Records
Tax History Compared to Growth
Tax History
| Year | Tax Paid | Tax Assessment Tax Assessment Total Assessment is a certain percentage of the fair market value that is determined by local assessors to be the total taxable value of land and additions on the property. | Land | Improvement |
|---|---|---|---|---|
| 2025 | $3,506 | $33,221 | $2,904 | $30,317 |
| 2024 | $3,395 | $32,253 | $2,904 | $29,349 |
| 2023 | $3,395 | $31,314 | $2,999 | $28,315 |
| 2022 | $3,157 | $30,402 | $2,878 | $27,524 |
| 2021 | $3,100 | $29,517 | $2,878 | $26,639 |
| 2020 | $3,070 | $29,517 | $2,878 | $26,639 |
| 2019 | $2,786 | $26,421 | $2,878 | $23,543 |
| 2018 | $2,717 | $26,005 | $2,878 | $23,127 |
| 2017 | $2,829 | $27,643 | $2,586 | $25,057 |
| 2016 | $2,777 | $26,838 | $2,613 | $24,225 |
| 2015 | $2,736 | $26,056 | $2,292 | $23,764 |
| 2014 | $2,734 | $25,298 | $2,163 | $23,135 |
Source: Public Records
Map
Nearby Homes
- 817 Carrie Ct
- 0 Bella Ct Unit 1156845
- 0 Bella Ct Unit 1156680
- 0 Eagles Nest Unit 1152121
- 0 Bluestem Ct
- 3127 Northridge Dr
- 0 Sage Ct
- 2907 Blue Stem Ct
- 2915 Ridgecrest Dr
- 2907 Ridgecrest Dr
- 1027 Woodbrook Blvd
- 3534 N 9th Ave
- 2115 N 9th Ave
- 937 Luglena Ln
- 23193 Grandview Ln
- 22453 State Highway 74
- 0000 N Green Ave
- 1027 W Windsor Way
- 1203 Mayes St
- 7000 Duffy Rd
- 804 Carrie Ct
- 812 Carrie Ct
- 0 Carrie Ct
- 10 Carrie Ct
- 0 N 9th St Unit 1029009
- 809 Carrie Ct
- 813 Carrie Ct
- 805 Carrie Ct
- 3087 Thousand Oaks Dr
- 813 Bella Ct
- 814 Bella Ct
- 805 Bella Ct
- 801 Carrie Ct
- 0 N The Cliffs Dr
- 805 The Cliffs Dr
- 801 The Cliffs Dr
- 0 Bella Ct Unit 1070749
- 0 Bella Ct Unit 1070739
- 0 Bella Ct Unit 1029142
- 0 Bella Ct Unit 1029046