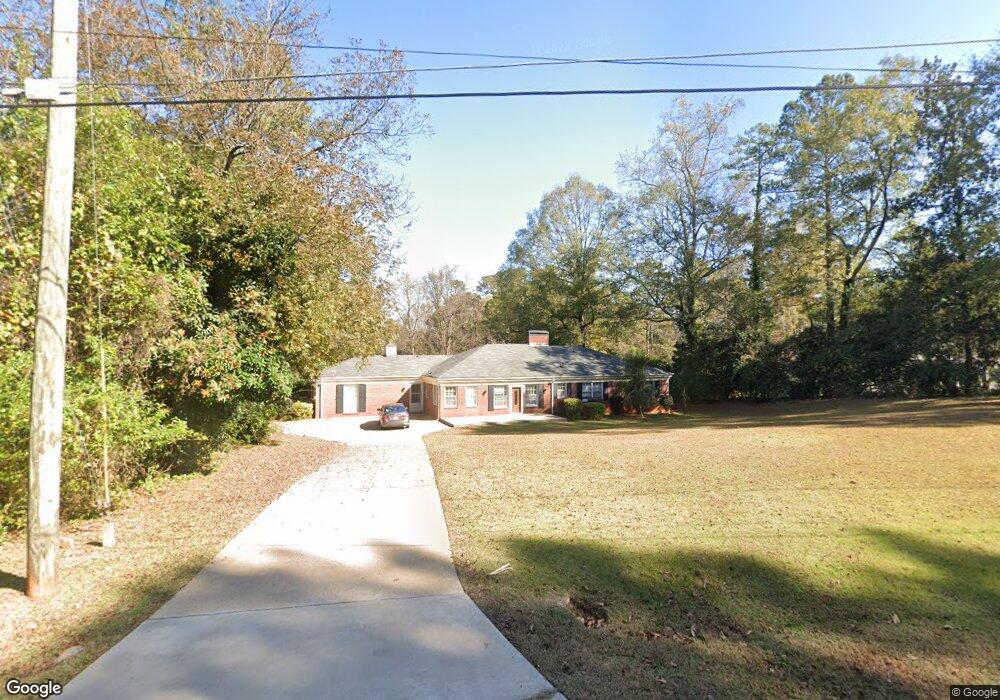
808 Cherokee Rd Lagrange, GA 30240
Estimated Value: $353,117 - $421,000
4
Beds
3
Baths
2,800
Sq Ft
$140/Sq Ft
Est. Value
About This Home
This home is located at 808 Cherokee Rd, Lagrange, GA 30240 and is currently estimated at $392,279, approximately $140 per square foot. 808 Cherokee Rd is a home located in Troup County with nearby schools including Hollis Hand Elementary School, Franklin Forest Elementary School, and Ethel W. Kight Elementary School.
Ownership History
Date
Name
Owned For
Owner Type
Purchase Details
Closed on
Nov 30, 2006
Sold by
Griffith Sandra J
Bought by
Benham Barry R
Current Estimated Value
Home Financials for this Owner
Home Financials are based on the most recent Mortgage that was taken out on this home.
Original Mortgage
$168,000
Outstanding Balance
$98,786
Interest Rate
6.29%
Mortgage Type
New Conventional
Estimated Equity
$293,493
Purchase Details
Closed on
Apr 15, 2005
Sold by
Pennebaker Shirley M
Bought by
Griffith Sandra J
Home Financials for this Owner
Home Financials are based on the most recent Mortgage that was taken out on this home.
Original Mortgage
$93,000
Interest Rate
5.88%
Mortgage Type
New Conventional
Purchase Details
Closed on
Jun 26, 1998
Sold by
Rowie Durden
Bought by
Pennebaker Shirley
Purchase Details
Closed on
Aug 30, 1993
Sold by
Elizabeth A Many By Ex
Bought by
Rowie Durden
Purchase Details
Closed on
Nov 20, 1989
Sold by
Walter G Many
Bought by
Elizabeth A Many By Ex
Purchase Details
Closed on
Jan 1, 1964
Sold by
Nat G Slaughter
Bought by
Walter G Many
Create a Home Valuation Report for This Property
The Home Valuation Report is an in-depth analysis detailing your home's value as well as a comparison with similar homes in the area
Purchase History
| Date | Buyer | Sale Price | Title Company |
|---|---|---|---|
| Benham Barry R | $210,000 | -- | |
| Benham Barry R | $210,000 | -- | |
| Griffith Sandra J | $165,000 | -- | |
| Pennebaker Shirley | $130,000 | -- | |
| Rowie Durden | -- | -- | |
| Elizabeth A Many By Ex | -- | -- | |
| Walter G Many | -- | -- |
Source: Public Records
Mortgage History
| Date | Status | Borrower | Loan Amount |
|---|---|---|---|
| Open | Benham Barry R | $168,000 | |
| Closed | Benham Barry R | $168,000 | |
| Previous Owner | Griffith Sandra J | $93,000 |
Source: Public Records
Tax History
| Year | Tax Paid | Tax Assessment Tax Assessment Total Assessment is a certain percentage of the fair market value that is determined by local assessors to be the total taxable value of land and additions on the property. | Land | Improvement |
|---|---|---|---|---|
| 2025 | $3,560 | $145,560 | $18,000 | $127,560 |
| 2024 | $2,914 | $108,840 | $18,000 | $90,840 |
| 2023 | $2,694 | $100,760 | $12,400 | $88,360 |
| 2022 | $2,596 | $95,000 | $12,400 | $82,600 |
| 2021 | $2,757 | $93,400 | $12,400 | $81,000 |
| 2020 | $2,757 | $93,400 | $12,400 | $81,000 |
| 2019 | $2,769 | $93,800 | $12,400 | $81,400 |
| 2018 | $2,652 | $89,920 | $12,400 | $77,520 |
| 2017 | $2,523 | $85,640 | $12,400 | $73,240 |
| 2016 | $2,505 | $85,041 | $12,400 | $72,641 |
| 2015 | $2,509 | $85,041 | $12,400 | $72,641 |
| 2014 | $2,468 | $83,544 | $12,400 | $71,144 |
| 2013 | -- | $64,287 | $12,400 | $51,887 |
Source: Public Records
Map
Nearby Homes
- 420 Ridgecrest Rd
- 705 Piney Woods Dr
- 724 Camellia Dr
- 106 Ewing St
- 216 E Lane Cir
- 732 Camellia Dr
- 203 S Chilton Crescent
- 201 S Chilton Crescent
- 222 Beechwood Cir
- 105 Saynor Cir
- 203 Waverly Way
- 0 Hills and Dales Farm Rd
- 109 Thomas St
- 219 Banks St
- 900 North St
- 118 Highland Ave
- 110 Russell St
- 204 Colonial St
- 102 Beech Creek Dr
- 0 Ridley Ave Unit 10550104
- 814 Cherokee Rd
- 829 Piney Woods Dr
- 831 Piney Woods Dr
- 813 Cherokee Rd
- 827 Piney Woods Dr
- 820 Cherokee Rd
- 800 Cherokee Rd
- 815 Cherokee Rd
- 712 Larose Terrace
- 718 Larose Terrace
- 801 Cherokee Rd
- 836 Piney Woods Dr
- 845 Piney Woods Dr
- 823 Piney Woods Dr
- 828 Piney Woods Dr
- 724 Larose Terrace
- 826 Cherokee Rd
- 772 Cherokee Rd
- 728 Larose Terrace
- 821 Piney Woods Dr
Your Personal Tour Guide
Ask me questions while you tour the home.