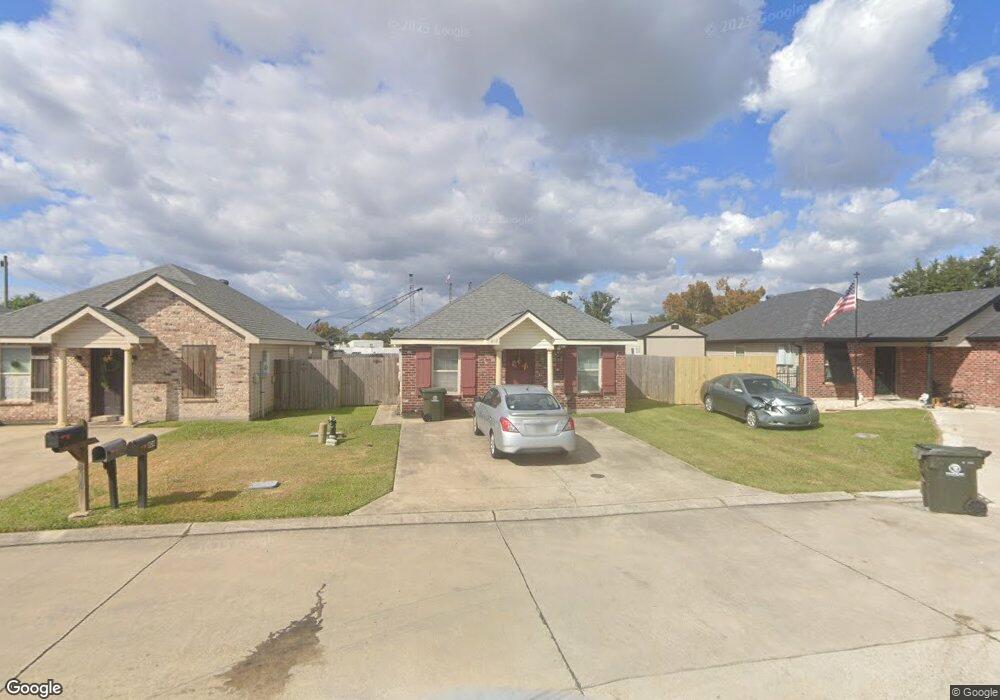
808 Cottagemill Ln Houma, LA 70363
Acadian NeighborhoodEstimated Value: $125,422 - $182,000
3
Beds
2
Baths
1,006
Sq Ft
$149/Sq Ft
Est. Value
About This Home
This home is located at 808 Cottagemill Ln, Houma, LA 70363 and is currently estimated at $149,856, approximately $148 per square foot. 808 Cottagemill Ln is a home located in Terrebonne Parish with nearby schools including Acadian Elementary School, Oaklawn Middle School, and Ellender Memorial High School.
Ownership History
Date
Name
Owned For
Owner Type
Purchase Details
Closed on
Jun 16, 2021
Sold by
Truong Gam T and Nguyen Thong J
Bought by
Vantruong Viet H
Current Estimated Value
Home Financials for this Owner
Home Financials are based on the most recent Mortgage that was taken out on this home.
Original Mortgage
$80,000
Outstanding Balance
$72,430
Interest Rate
2.9%
Mortgage Type
Purchase Money Mortgage
Estimated Equity
$77,426
Purchase Details
Closed on
Oct 10, 2019
Sold by
Truong-Nguyen Gam
Bought by
Truong-Nguyen Gam
Purchase Details
Closed on
Jan 29, 2009
Sold by
Cavco Ventures Inc
Bought by
Troung Gam Thi
Create a Home Valuation Report for This Property
The Home Valuation Report is an in-depth analysis detailing your home's value as well as a comparison with similar homes in the area
Home Values in the Area
Average Home Value in this Area
Purchase History
| Date | Buyer | Sale Price | Title Company |
|---|---|---|---|
| Vantruong Viet H | $100,000 | None Available | |
| Truong-Nguyen Gam | -- | -- | |
| Troung Gam Thi | $119,900 | Alliance Title Llc | |
| Troung Gam Thi | $119,900 | Alliance Title Llc |
Source: Public Records
Mortgage History
| Date | Status | Borrower | Loan Amount |
|---|---|---|---|
| Open | Vantruong Viet H | $80,000 | |
| Closed | Troung Gam Thi | $0 |
Source: Public Records
Tax History Compared to Growth
Tax History
| Year | Tax Paid | Tax Assessment Tax Assessment Total Assessment is a certain percentage of the fair market value that is determined by local assessors to be the total taxable value of land and additions on the property. | Land | Improvement |
|---|---|---|---|---|
| 2024 | $1,191 | $12,690 | $3,400 | $9,290 |
| 2023 | $1,214 | $12,090 | $3,240 | $8,850 |
| 2022 | $1,124 | $12,090 | $3,240 | $8,850 |
| 2021 | $1,017 | $11,210 | $3,240 | $7,970 |
| 2020 | $1,040 | $12,090 | $3,240 | $8,850 |
| 2019 | $1,207 | $12,890 | $3,240 | $9,650 |
| 2018 | $1,171 | $12,280 | $3,090 | $9,190 |
| 2017 | $1,179 | $12,280 | $3,090 | $9,190 |
| 2015 | $923 | $11,695 | $2,940 | $8,755 |
| 2014 | $1,111 | $11,695 | $0 | $0 |
| 2013 | $1,113 | $11,695 | $0 | $0 |
Source: Public Records
Map
Nearby Homes
- 613, 615, 617 Saadi St
- 228 Saint Pius St
- 132 Quartermill Ln
- 221 Pontiff St
- 1204 Acadian Dr
- 1315 Center St
- 883 Centurion Ln
- 1300 Honduras St
- 616 Beatrice St
- 901 Liberty St
- 1301 & 1301 1/2 Bourg St
- 1301 Ellender St
- 1225 Lee Ave
- 531 Engeron St
- 1419 Acadian Dr
- 118 Lois Rd
- 712 May St
- 1465 Ellender St
- 1118 Academy St
- 1002 Aycock St
- 810 Cottagemill Ln
- 804 Cottagemill Ln
- 812 Cottagemill Ln
- 814 Cottagemill Ln
- 805 Cottagemill Ln
- 811 Cottagemill Ln
- 816 Saadi St
- 814 Saadi St
- 818 Saadi St
- 815 Cottagemill Ln
- 818 Cottagemill Ln
- 810 Saadi St
- 212 Saint Pius St
- 210 Saint Pius St
- 822 Saadi St
- 214 Saint Pius St
- 810 B Saadi St
- 819 Cottagemill Ln
- 806 Saadi St
- 821 Cottagemill Ln