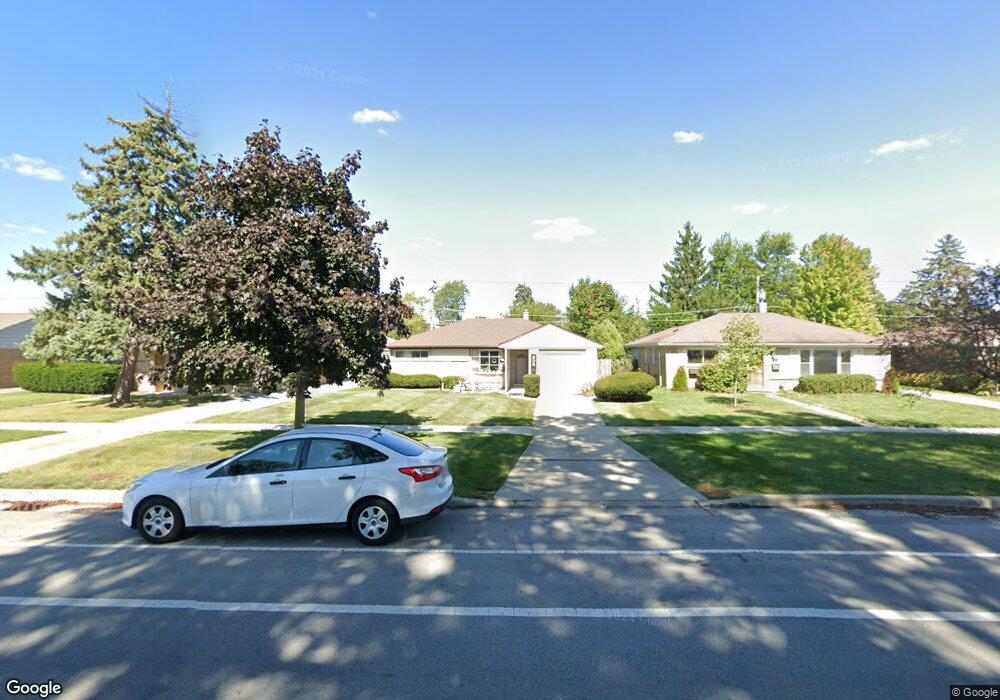
808 E Algonquin Rd Des Plaines, IL 60016
Estimated Value: $328,000 - $357,000
3
Beds
1
Bath
1,280
Sq Ft
$271/Sq Ft
Est. Value
About This Home
This home is located at 808 E Algonquin Rd, Des Plaines, IL 60016 and is currently estimated at $346,296, approximately $270 per square foot. 808 E Algonquin Rd is a home located in Cook County with nearby schools including Forest Elementary School, Algonquin Middle School, and Maine West High School.
Ownership History
Date
Name
Owned For
Owner Type
Purchase Details
Closed on
Aug 9, 2021
Sold by
Grant June L and June L Grant Declaration Of Tr
Bought by
Grant June L and June L Grant Declaration Of Tr
Current Estimated Value
Purchase Details
Closed on
May 27, 1999
Sold by
Grant June L
Bought by
Grant June L
Purchase Details
Closed on
May 22, 1997
Sold by
Galli Richard and Galli Judith
Bought by
Grant Bernard and Grant June
Create a Home Valuation Report for This Property
The Home Valuation Report is an in-depth analysis detailing your home's value as well as a comparison with similar homes in the area
Home Values in the Area
Average Home Value in this Area
Purchase History
| Date | Buyer | Sale Price | Title Company |
|---|---|---|---|
| Grant June L | -- | Accommodation | |
| Grant June L | -- | -- | |
| Grant Bernard | $140,000 | -- |
Source: Public Records
Tax History
| Year | Tax Paid | Tax Assessment Tax Assessment Total Assessment is a certain percentage of the fair market value that is determined by local assessors to be the total taxable value of land and additions on the property. | Land | Improvement |
|---|---|---|---|---|
| 2025 | $1,399 | $30,000 | $6,201 | $23,799 |
| 2024 | $1,399 | $26,001 | $5,168 | $20,833 |
| 2023 | $1,408 | $26,001 | $5,168 | $20,833 |
| 2022 | $1,408 | $26,001 | $5,168 | $20,833 |
| 2021 | $1,638 | $24,953 | $4,306 | $20,647 |
| 2020 | $5,853 | $24,953 | $4,306 | $20,647 |
| 2019 | $5,884 | $28,038 | $4,306 | $23,732 |
| 2018 | $1,644 | $21,956 | $3,789 | $18,167 |
| 2017 | $1,587 | $21,956 | $3,789 | $18,167 |
| 2016 | $2,181 | $21,956 | $3,789 | $18,167 |
| 2015 | $2,492 | $17,788 | $3,272 | $14,516 |
| 2014 | $2,389 | $17,788 | $3,272 | $14,516 |
| 2013 | $2,385 | $17,788 | $3,272 | $14,516 |
Source: Public Records
Map
Nearby Homes
- 1162 W Grant Dr
- 674 E Algonquin Rd
- 1205 S Wolf Rd
- 1394 Carol Ln
- 980 W Grant Dr
- 1122 Alfini Dr
- 886 E Thacker St
- 505 Forest Ave
- 1080 Bogart St
- 664 E Oakton St
- 815 E Oakton St Unit 311
- 652 E Prairie Ave
- 1596 Oxford Rd
- 1107 E Prairie Ave
- 584 S 4th Ave
- 1380 Oakwood Ave Unit 306
- 508 Crestwood Dr
- 799 Graceland Ave Unit 404A
- 900 Center St Unit 3A
- 556 Orchard Ct
- 800 E Algonquin Rd
- 816 E Algonquin Rd
- 792 E Algonquin Rd
- 824 E Algonquin Rd
- 1172 W Grant Dr
- 1174 W Grant Dr
- 782 E Algonquin Rd
- 830 E Algonquin Rd
- 1168 W Grant Dr
- 1176 W Grant Dr
- 1164 Southeast Place
- 1208 Earl Ave
- 1166 W Grant Dr
- 838 E Algonquin Rd
- 774 E Algonquin Rd
- 1178 W Grant Dr
- 1164 W Grant Dr
- 1216 Earl Ave
- 766 E Algonquin Rd
- 1209 Earl Ave
Your Personal Tour Guide
Ask me questions while you tour the home.