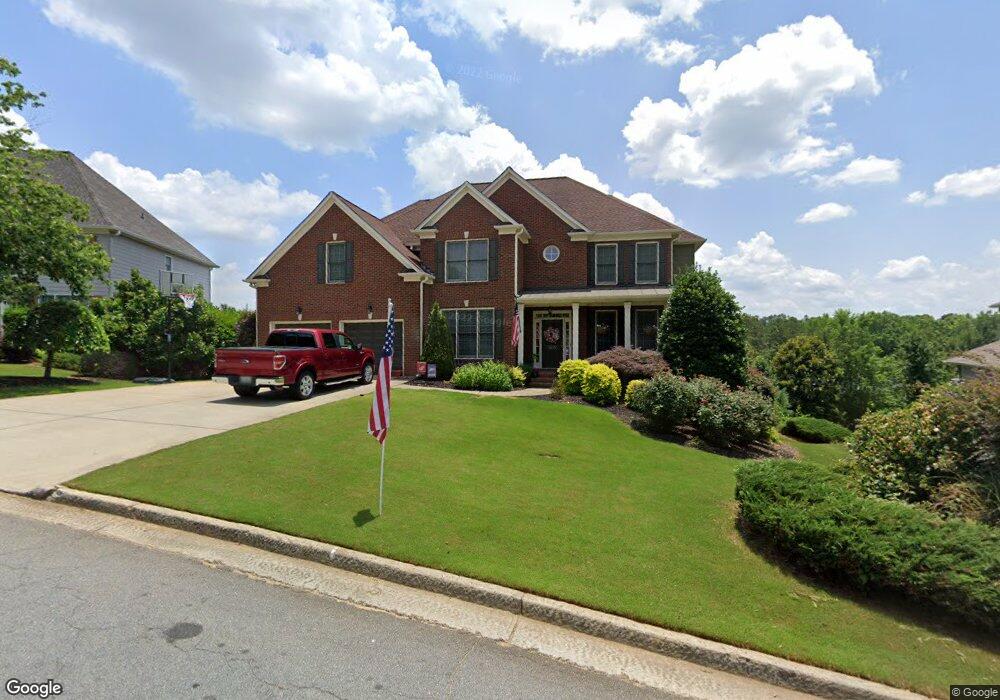
808 Golden Wood Trace Unit 4C Canton, GA 30114
Estimated Value: $691,201 - $720,000
5
Beds
5
Baths
4,341
Sq Ft
$163/Sq Ft
Est. Value
About This Home
This home is located at 808 Golden Wood Trace Unit 4C, Canton, GA 30114 and is currently estimated at $705,601, approximately $162 per square foot. 808 Golden Wood Trace Unit 4C is a home located in Cherokee County with nearby schools including Liberty Elementary School, Freedom Middle School, and Cherokee High School.
Ownership History
Date
Name
Owned For
Owner Type
Purchase Details
Closed on
Jun 8, 2018
Sold by
Larsen Brian
Bought by
Larsen Brian and Larsen Kimberly Champion
Current Estimated Value
Home Financials for this Owner
Home Financials are based on the most recent Mortgage that was taken out on this home.
Original Mortgage
$312,000
Outstanding Balance
$269,828
Interest Rate
4.5%
Mortgage Type
New Conventional
Estimated Equity
$435,773
Purchase Details
Closed on
Aug 3, 2016
Sold by
Ivory D
Bought by
Williams Cheryl Ivory
Purchase Details
Closed on
Aug 16, 2004
Sold by
Ogilvie Custom Home Builders Inc
Bought by
Williams Ivory D and Williams Cheryl
Home Financials for this Owner
Home Financials are based on the most recent Mortgage that was taken out on this home.
Original Mortgage
$200,000
Interest Rate
5.96%
Create a Home Valuation Report for This Property
The Home Valuation Report is an in-depth analysis detailing your home's value as well as a comparison with similar homes in the area
Home Values in the Area
Average Home Value in this Area
Purchase History
| Date | Buyer | Sale Price | Title Company |
|---|---|---|---|
| Larsen Brian | -- | -- | |
| Larsen Brian | $390,000 | -- | |
| Williams Cheryl Ivory | -- | -- | |
| Williams Ivory D | $325,900 | -- |
Source: Public Records
Mortgage History
| Date | Status | Borrower | Loan Amount |
|---|---|---|---|
| Open | Larsen Brian | $312,000 | |
| Closed | Larsen Brian | $312,000 | |
| Previous Owner | Williams Ivory D | $200,000 |
Source: Public Records
Tax History Compared to Growth
Tax History
| Year | Tax Paid | Tax Assessment Tax Assessment Total Assessment is a certain percentage of the fair market value that is determined by local assessors to be the total taxable value of land and additions on the property. | Land | Improvement |
|---|---|---|---|---|
| 2024 | $5,754 | $243,720 | $46,000 | $197,720 |
| 2023 | $5,169 | $236,600 | $46,000 | $190,600 |
| 2022 | $4,906 | $200,720 | $36,000 | $164,720 |
| 2021 | $4,551 | $167,960 | $28,800 | $139,160 |
| 2020 | $4,306 | $157,240 | $28,800 | $128,440 |
| 2019 | $4,136 | $149,920 | $28,800 | $121,120 |
| 2018 | $1,227 | $138,320 | $27,200 | $111,120 |
| 2017 | $1,225 | $341,000 | $27,200 | $109,200 |
| 2016 | $1,225 | $324,200 | $27,200 | $102,480 |
| 2015 | $1,161 | $300,400 | $24,000 | $96,160 |
| 2014 | $1,128 | $291,900 | $24,000 | $92,760 |
Source: Public Records
Map
Nearby Homes
- 429 Arrowhead Trail
- 422 Arrowhead Trail
- 410 Arrowhead Trail
- 312 Gold Mill Trail
- 229 Crestwood Dr
- 3087 Woodbridge Ln Unit 3L
- 3085 Woodbridge Ln
- 152 Gold Mill Place Unit 4F
- 259 Deer Valley Run
- 272 Deer Valley Run
- 273 Deer Valley Run
- 292 Deer Valley Run
- 139 Gold Mill Place Unit 4F
- 305 Deer Valley Run
- 309 Deer Valley Run
- 252 Deer Valley Run
- 113 Gold Bridge Crossing
- 342 Providence Walk Way
- 4123 Gold Mill Ridge
- 806 Golden Wood Trace Unit 4C
- 810 Golden Wood Trace
- 4064 Gold Mill Ridge Unit 4C
- 4066 Gold Mill Ridge Unit 4C
- 4070 Gold Mill Ridge Unit 4C
- 4062 Gold Mill Ridge
- 804 Golden Wood Trace
- 812 Golden Wood Trace Unit 4C
- 901 Gold Ridge Ct
- 4076 Gold Mill Ridge
- 805 Golden Wood Trace
- 4078 Gold Mill Ridge Unit 4C
- 4060 Gold Mill Ridge
- 802 Golden Wood Trace
- 903 Gold Ridge Ct Unit 4167
- 903 Gold Ridge Ct
- 0 Gold Ridge Ct Unit 8123243
- 0 Gold Ridge Ct Unit 8161732
- 4080 Gold Mill Ridge
- 803 Golden Wood Trace Unit 4C