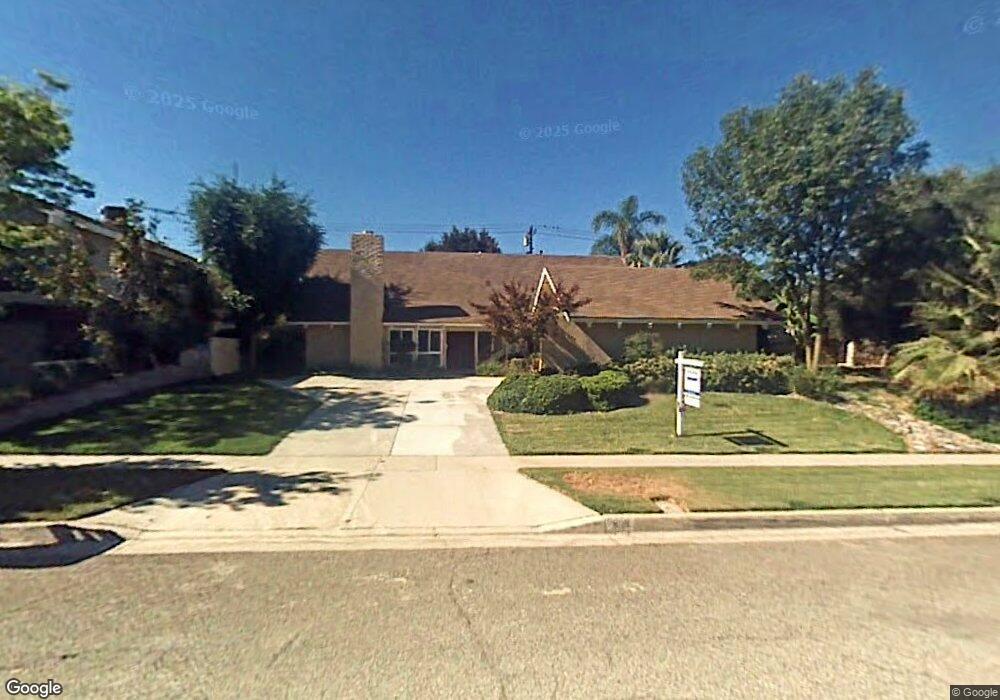
808 La Paloma St Redlands, CA 92373
South Redlands NeighborhoodEstimated Value: $640,000 - $788,429
5
Beds
3
Baths
2,434
Sq Ft
$308/Sq Ft
Est. Value
About This Home
This home is located at 808 La Paloma St, Redlands, CA 92373 and is currently estimated at $748,607, approximately $307 per square foot. 808 La Paloma St is a home located in San Bernardino County with nearby schools including Kingsbury Elementary School, Cope Middle School, and Redlands Senior High School.
Ownership History
Date
Name
Owned For
Owner Type
Purchase Details
Closed on
Apr 29, 2008
Sold by
Guajardo Lidia
Bought by
Guajardo Jose Ballardo
Current Estimated Value
Home Financials for this Owner
Home Financials are based on the most recent Mortgage that was taken out on this home.
Original Mortgage
$394,250
Outstanding Balance
$248,567
Interest Rate
5.88%
Mortgage Type
Purchase Money Mortgage
Estimated Equity
$500,040
Purchase Details
Closed on
Apr 21, 2008
Sold by
Pennington James M and Pennington Mafalda T
Bought by
Guajardo Jose B
Home Financials for this Owner
Home Financials are based on the most recent Mortgage that was taken out on this home.
Original Mortgage
$394,250
Outstanding Balance
$248,567
Interest Rate
5.88%
Mortgage Type
Purchase Money Mortgage
Estimated Equity
$500,040
Purchase Details
Closed on
May 22, 2006
Sold by
Barnett Cheryl A
Bought by
Pennington James M and Pennington Mafalda T
Purchase Details
Closed on
Nov 9, 2001
Sold by
Barnett Cheryl A and Barnett Cheryl
Bought by
Barnett Cheryl A
Purchase Details
Closed on
Jun 21, 2001
Sold by
Aames Capital Corp
Bought by
Barnett Cheryl
Home Financials for this Owner
Home Financials are based on the most recent Mortgage that was taken out on this home.
Original Mortgage
$154,000
Interest Rate
7.26%
Purchase Details
Closed on
Oct 11, 2000
Sold by
Rezac Jack and Rezac Carol
Bought by
Aames Capital Corp and Dba Aames Home Loan
Purchase Details
Closed on
Aug 4, 1999
Sold by
Rezac Jack and Rezac Carol
Bought by
Rezac Jack and Rezac Carol
Home Financials for this Owner
Home Financials are based on the most recent Mortgage that was taken out on this home.
Original Mortgage
$209,500
Interest Rate
7.47%
Purchase Details
Closed on
Nov 19, 1998
Sold by
Capitani Dwight A and Capitani Elizabeth S
Bought by
Rezac Jack and Rezac Carol
Home Financials for this Owner
Home Financials are based on the most recent Mortgage that was taken out on this home.
Original Mortgage
$195,500
Interest Rate
6.84%
Mortgage Type
Seller Take Back
Purchase Details
Closed on
Mar 14, 1994
Sold by
Sooy John D and Sooy Kris
Bought by
Capitani Dwight A and Capitani Elizabeth S
Home Financials for this Owner
Home Financials are based on the most recent Mortgage that was taken out on this home.
Original Mortgage
$167,191
Interest Rate
7.67%
Mortgage Type
Seller Take Back
Create a Home Valuation Report for This Property
The Home Valuation Report is an in-depth analysis detailing your home's value as well as a comparison with similar homes in the area
Home Values in the Area
Average Home Value in this Area
Purchase History
| Date | Buyer | Sale Price | Title Company |
|---|---|---|---|
| Guajardo Jose Ballardo | -- | Fidelity National Title Co | |
| Guajardo Jose B | $415,000 | Fidelity National Title Co | |
| Pennington James M | $383,000 | Chicago Title Company | |
| Barnett Cheryl A | -- | Fidelity National Title Co | |
| Barnett Cheryl | $192,500 | Fidelity National Title | |
| Aames Capital Corp | $225,415 | Orange Coast Title | |
| Rezac Jack | -- | Stewart Title Company | |
| Rezac Jack | $209,000 | Northern Counties Title | |
| Capitani Dwight A | $28,000 | First American Title Ins Co |
Source: Public Records
Mortgage History
| Date | Status | Borrower | Loan Amount |
|---|---|---|---|
| Open | Guajardo Jose B | $394,250 | |
| Previous Owner | Barnett Cheryl | $154,000 | |
| Previous Owner | Rezac Jack | $209,500 | |
| Previous Owner | Rezac Jack | $195,500 | |
| Previous Owner | Capitani Dwight A | $167,191 | |
| Closed | Capitani Dwight A | $22,808 | |
| Closed | Rezac Jack | $5,000 | |
| Closed | Barnett Cheryl | $38,500 |
Source: Public Records
Tax History Compared to Growth
Tax History
| Year | Tax Paid | Tax Assessment Tax Assessment Total Assessment is a certain percentage of the fair market value that is determined by local assessors to be the total taxable value of land and additions on the property. | Land | Improvement |
|---|---|---|---|---|
| 2025 | $6,241 | $545,112 | $163,535 | $381,577 |
| 2024 | $6,241 | $534,423 | $160,328 | $374,095 |
| 2023 | $6,232 | $523,944 | $157,184 | $366,760 |
| 2022 | $6,140 | $513,671 | $154,102 | $359,569 |
| 2021 | $6,251 | $503,599 | $151,080 | $352,519 |
| 2020 | $5,903 | $478,000 | $143,200 | $334,800 |
| 2019 | $5,679 | $464,000 | $139,000 | $325,000 |
| 2018 | $5,500 | $452,000 | $135,100 | $316,900 |
| 2017 | $5,372 | $436,700 | $130,500 | $306,200 |
| 2016 | $5,060 | $408,200 | $122,000 | $286,200 |
| 2015 | $4,718 | $378,000 | $113,000 | $265,000 |
| 2014 | $4,498 | $360,000 | $108,000 | $252,000 |
Source: Public Records
Map
Nearby Homes
- 812 Orchard Dr
- 826 La Paloma St
- 412 Phlox Ct
- 638 Cypress Cir
- 709 Calle de Silva
- 261 E Crescent Ave
- 0 W Palm Ave Unit IV25244005
- 525 La Verne St Unit 14
- 246 E Fern Ave Unit 210
- 242 E Fern Ave Unit 208
- 238 E Fern Ave Unit 204
- 501 Lemon St
- 220 W Highland Ave
- 1033 Evergreen Ct
- 331 Nordina St
- 101 W Fern Ave
- 302 Sonora St
- 743 Mcauliffe Ct
- 250 Sonora St
- 527 W Palm Ave
- 806 La Paloma St
- 810 La Paloma St
- 813 Hibiscus Dr
- 809 Hibiscus Dr
- 814 La Paloma St
- 804 La Paloma St
- 817 Hibiscus Dr
- 412 Lotus Ct
- 805 Hibiscus Dr
- 411 Lotus Ct
- 821 Hibiscus Dr
- 820 La Paloma St
- 411 Phlox Ct
- 802 La Paloma St
- 418 Lotus Ct
- 812 Hibiscus Dr
- 302 E Palm Ave
- 417 Lotus Ct
- 412 E Palm Ave
- 237 Phlox Ave