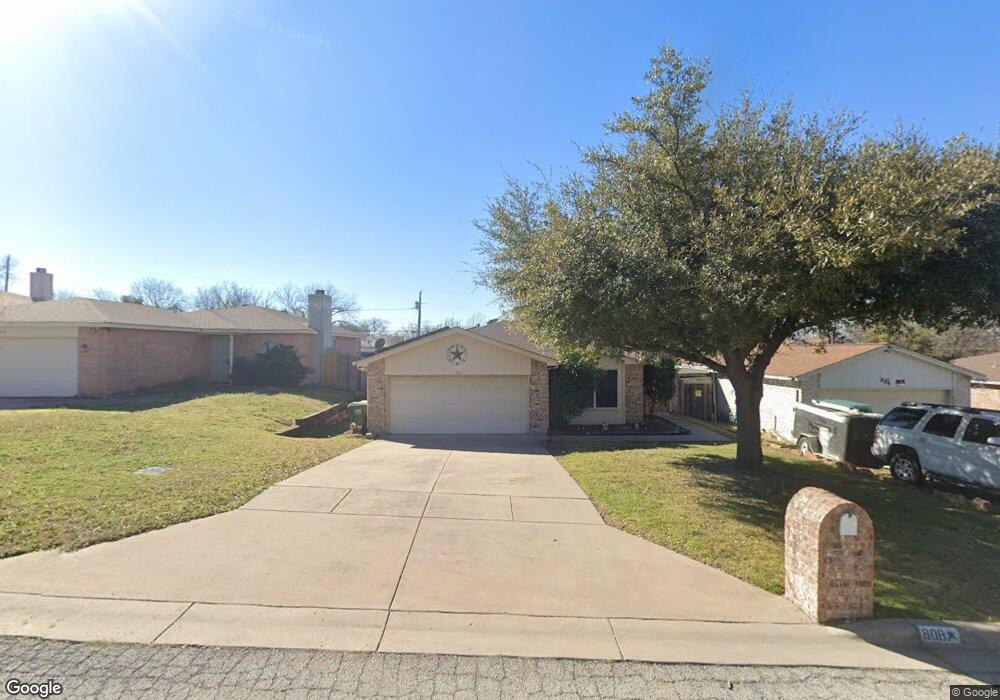
808 Max St Fort Worth, TX 76108
Estimated Value: $215,678 - $245,000
2
Beds
2
Baths
1,147
Sq Ft
$201/Sq Ft
Est. Value
About This Home
This home is located at 808 Max St, Fort Worth, TX 76108 and is currently estimated at $230,420, approximately $200 per square foot. 808 Max St is a home located in Tarrant County with nearby schools including West Elementary School, Brewer Middle School, and Tannahill Intermediate School.
Ownership History
Date
Name
Owned For
Owner Type
Purchase Details
Closed on
Jan 11, 1999
Sold by
Optima Builders Inc
Bought by
Hinton Debbie Joe and Hinton Nettie Ann
Current Estimated Value
Home Financials for this Owner
Home Financials are based on the most recent Mortgage that was taken out on this home.
Original Mortgage
$78,584
Outstanding Balance
$18,070
Interest Rate
6.66%
Mortgage Type
FHA
Estimated Equity
$212,350
Purchase Details
Closed on
Nov 19, 1998
Sold by
Lake Hollow Corp
Bought by
Optima Builders Inc
Home Financials for this Owner
Home Financials are based on the most recent Mortgage that was taken out on this home.
Original Mortgage
$78,584
Outstanding Balance
$18,070
Interest Rate
6.66%
Mortgage Type
FHA
Estimated Equity
$212,350
Create a Home Valuation Report for This Property
The Home Valuation Report is an in-depth analysis detailing your home's value as well as a comparison with similar homes in the area
Home Values in the Area
Average Home Value in this Area
Purchase History
| Date | Buyer | Sale Price | Title Company |
|---|---|---|---|
| Hinton Debbie Joe | -- | Alamo Title Company | |
| Optima Builders Inc | -- | Alamo Title Company |
Source: Public Records
Mortgage History
| Date | Status | Borrower | Loan Amount |
|---|---|---|---|
| Open | Hinton Debbie Joe | $78,584 | |
| Previous Owner | Optima Builders Inc | $78,000 |
Source: Public Records
Tax History
| Year | Tax Paid | Tax Assessment Tax Assessment Total Assessment is a certain percentage of the fair market value that is determined by local assessors to be the total taxable value of land and additions on the property. | Land | Improvement |
|---|---|---|---|---|
| 2025 | $1,252 | $219,000 | $37,250 | $181,750 |
| 2024 | $1,252 | $238,655 | $37,250 | $201,405 |
| 2023 | $4,315 | $225,000 | $37,250 | $187,750 |
| 2022 | $4,468 | $165,000 | $25,000 | $140,000 |
| 2021 | $4,297 | $165,000 | $25,000 | $140,000 |
| 2020 | $3,935 | $142,000 | $25,000 | $117,000 |
| 2019 | $3,715 | $142,000 | $25,000 | $117,000 |
| 2018 | $1,599 | $117,394 | $12,000 | $105,394 |
| 2017 | $3,119 | $116,697 | $12,000 | $104,697 |
| 2016 | $2,835 | $110,040 | $12,000 | $98,040 |
| 2015 | $1,730 | $88,200 | $10,000 | $78,200 |
| 2014 | $1,730 | $88,200 | $10,000 | $78,200 |
Source: Public Records
Map
Nearby Homes
- 826 Mirike Dr
- 841 Lake View Ridge
- 8512 Whitney Dr
- 8437 Redonda St
- 8549 Michael St
- 8552 Gibbs Dr
- 501 Pemberton St
- 1022 Lakeview Ridge
- 8237 Albert St
- 8320 Redonda St
- 521 Grant Cir
- 1725 S Las Vegas Trail
- 8316 Sussex St
- 508 Grant Cir
- 8224 Carlos St
- 651 Meadow Park Dr
- 726 Kimbrough St
- 8508 Hanon Dr
- 8908 Jill St
- 8210 Sussex St
Your Personal Tour Guide
Ask me questions while you tour the home.