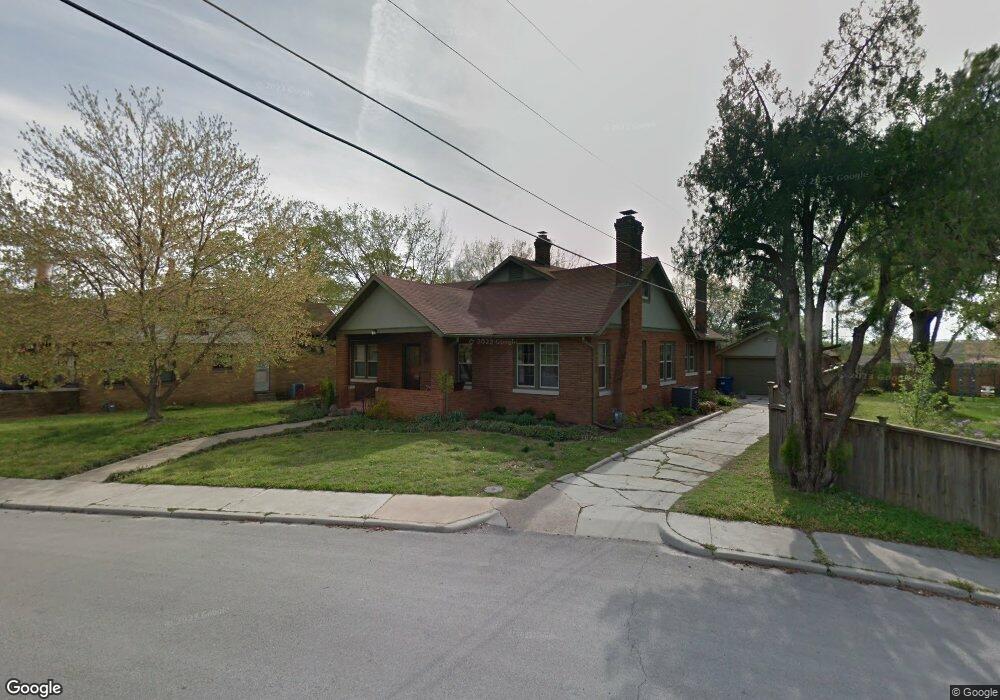
808 N Jackson Ave Joplin, MO 64801
Roanoke NeighborhoodEstimated Value: $296,000 - $380,000
4
Beds
2
Baths
3,186
Sq Ft
$103/Sq Ft
Est. Value
About This Home
This home is located at 808 N Jackson Ave, Joplin, MO 64801 and is currently estimated at $327,893, approximately $102 per square foot. 808 N Jackson Ave is a home located in Jasper County with nearby schools including Columbia Elementary School, North Middle School, and Joplin High School.
Ownership History
Date
Name
Owned For
Owner Type
Purchase Details
Closed on
Aug 31, 2016
Sold by
Morfeld Nicholas D and Morfeld Anna K
Bought by
Horton Nathan A and Horton Tracy E
Current Estimated Value
Purchase Details
Closed on
Oct 15, 2012
Sold by
Conrow B Doyle
Bought by
Morfield Nicholas D and Morfield Anna K
Home Financials for this Owner
Home Financials are based on the most recent Mortgage that was taken out on this home.
Original Mortgage
$124,000
Interest Rate
3.59%
Mortgage Type
New Conventional
Purchase Details
Closed on
May 28, 2008
Sold by
St Germain Scott M and St Germain Andrea J
Bought by
Conrow B Doyle
Purchase Details
Closed on
Jul 6, 2006
Sold by
Bishop Bradley G and Bishop Jill R
Bought by
St Germain Scott M and St Germain Andrea J
Home Financials for this Owner
Home Financials are based on the most recent Mortgage that was taken out on this home.
Original Mortgage
$134,500
Interest Rate
6.63%
Mortgage Type
Purchase Money Mortgage
Create a Home Valuation Report for This Property
The Home Valuation Report is an in-depth analysis detailing your home's value as well as a comparison with similar homes in the area
Home Values in the Area
Average Home Value in this Area
Purchase History
| Date | Buyer | Sale Price | Title Company |
|---|---|---|---|
| Horton Nathan A | -- | None Available | |
| Morfield Nicholas D | -- | None Available | |
| Conrow B Doyle | -- | Fatco | |
| St Germain Scott M | -- | Abbey |
Source: Public Records
Mortgage History
| Date | Status | Borrower | Loan Amount |
|---|---|---|---|
| Previous Owner | Morfield Nicholas D | $124,000 | |
| Previous Owner | St Germain Scott M | $134,500 |
Source: Public Records
Tax History Compared to Growth
Tax History
| Year | Tax Paid | Tax Assessment Tax Assessment Total Assessment is a certain percentage of the fair market value that is determined by local assessors to be the total taxable value of land and additions on the property. | Land | Improvement |
|---|---|---|---|---|
| 2024 | $1,559 | $33,780 | $3,970 | $29,810 |
| 2023 | $1,559 | $33,780 | $3,970 | $29,810 |
| 2022 | $1,524 | $33,140 | $3,970 | $29,170 |
| 2021 | $1,514 | $33,140 | $3,970 | $29,170 |
| 2020 | $1,428 | $30,570 | $3,970 | $26,600 |
| 2019 | $1,431 | $30,570 | $3,970 | $26,600 |
| 2018 | $1,377 | $29,540 | $0 | $0 |
| 2017 | $1,382 | $29,540 | $0 | $0 |
| 2016 | $1,104 | $23,900 | $0 | $0 |
| 2015 | $1,103 | $23,900 | $0 | $0 |
| 2014 | $1,103 | $23,900 | $0 | $0 |
Source: Public Records
Map
Nearby Homes
- 802 Hampton Place
- 629 W Islington Place
- 624 N Sergeant Ave
- 711 N Moffet Ave
- 1002 NW Murphy Blvd
- 535 N Byers Ave
- 915 W Kensington Rd
- 609 N Pearl Ave
- 605 N Pearl Ave
- 530 N Pearl Ave
- 428 N Sergeant Ave
- 509 N Byers Ave
- 437 N Moffet Ave
- 1025 Northridge Rd
- 525 N Pearl Ave
- 411 N Connor Ave
- 531 N Wall Ave
- 114 W F St
- 530 N Joplin Ave
- 401 N Byers St Ave
- 802 N Jackson Ave
- 808 Hampton Place
- 726 Hampton Place
- 902 Hampton Place
- 727 Glenview Place
- 722 Hampton Place
- 720 N Jackson Ave
- 809 Hampton Place
- 910 Hampton Place
- 801 Hampton Place
- 718 Hampton Place
- 714 N Jackson Ave
- 924 Hampton Place
- 717 Glenview Place
- 720 Glenview Place
- 720 Glenview Place Unit 1
- 710 N Jackson Ave
- 714 Hampton Place
- 901 Hampton Place
- 711 Hampton Place