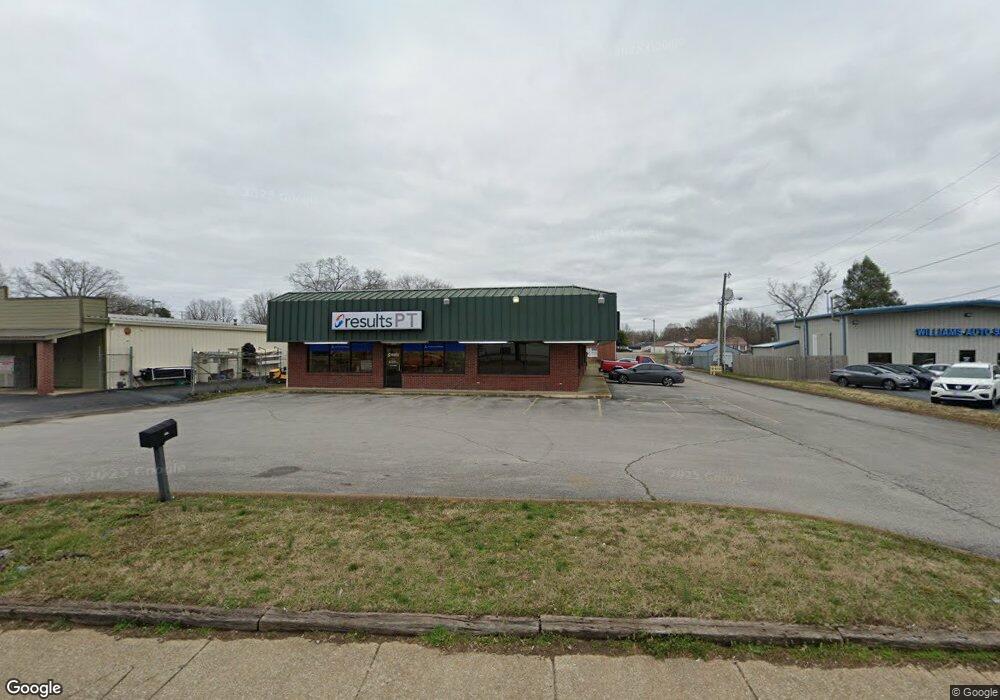
808 N Locust Ave Lawrenceburg, TN 38464
Estimated Value: $718,923
--
Bed
2
Baths
5,100
Sq Ft
$141/Sq Ft
Est. Value
About This Home
This home is located at 808 N Locust Ave, Lawrenceburg, TN 38464 and is currently estimated at $718,923, approximately $140 per square foot. 808 N Locust Ave is a home located in Lawrence County with nearby schools including Ingram Sowell Elementary School, Lawrenceburg Public Elementary School, and David Crockett Elementary School.
Ownership History
Date
Name
Owned For
Owner Type
Purchase Details
Closed on
Apr 10, 2015
Sold by
Tran Myhanh
Bought by
Cao Leim
Current Estimated Value
Home Financials for this Owner
Home Financials are based on the most recent Mortgage that was taken out on this home.
Original Mortgage
$238,000
Outstanding Balance
$184,083
Interest Rate
3.95%
Mortgage Type
Commercial
Estimated Equity
$534,840
Purchase Details
Closed on
Jun 10, 2010
Bought by
Tran Myhanh
Purchase Details
Closed on
Mar 27, 2007
Sold by
Anderson James M
Bought by
Le Tuan D
Home Financials for this Owner
Home Financials are based on the most recent Mortgage that was taken out on this home.
Original Mortgage
$204,866
Interest Rate
6.15%
Mortgage Type
Commercial
Purchase Details
Closed on
Jul 18, 1991
Bought by
Anderson James M and Anderson Robin M
Purchase Details
Closed on
Oct 4, 1934
Bought by
Whitten Jess L
Create a Home Valuation Report for This Property
The Home Valuation Report is an in-depth analysis detailing your home's value as well as a comparison with similar homes in the area
Home Values in the Area
Average Home Value in this Area
Purchase History
| Date | Buyer | Sale Price | Title Company |
|---|---|---|---|
| Cao Leim | $297,500 | -- | |
| Tran Myhanh | -- | -- | |
| Le Tuan D | $250,000 | -- | |
| Anderson James M | $44,000 | -- | |
| Whitten Jess L | -- | -- |
Source: Public Records
Mortgage History
| Date | Status | Borrower | Loan Amount |
|---|---|---|---|
| Open | Cao Leim | $238,000 | |
| Previous Owner | Whitten Jess L | $204,866 |
Source: Public Records
Tax History Compared to Growth
Tax History
| Year | Tax Paid | Tax Assessment Tax Assessment Total Assessment is a certain percentage of the fair market value that is determined by local assessors to be the total taxable value of land and additions on the property. | Land | Improvement |
|---|---|---|---|---|
| 2025 | $3,466 | $111,520 | $0 | $0 |
| 2024 | $3,466 | $111,520 | $21,880 | $89,640 |
| 2023 | $3,466 | $111,520 | $21,880 | $89,640 |
| 2022 | $3,466 | $111,520 | $21,880 | $89,640 |
| 2021 | $4,626 | $105,240 | $21,880 | $83,360 |
| 2020 | $4,626 | $105,240 | $21,880 | $83,360 |
| 2019 | $4,626 | $105,240 | $21,880 | $83,360 |
| 2018 | $4,626 | $105,240 | $21,880 | $83,360 |
| 2017 | $4,626 | $105,240 | $21,880 | $83,360 |
| 2016 | $4,626 | $105,240 | $21,880 | $83,360 |
| 2015 | $4,380 | $105,240 | $21,880 | $83,360 |
| 2014 | -- | $105,040 | $19,880 | $85,160 |
Source: Public Records
Map
Nearby Homes