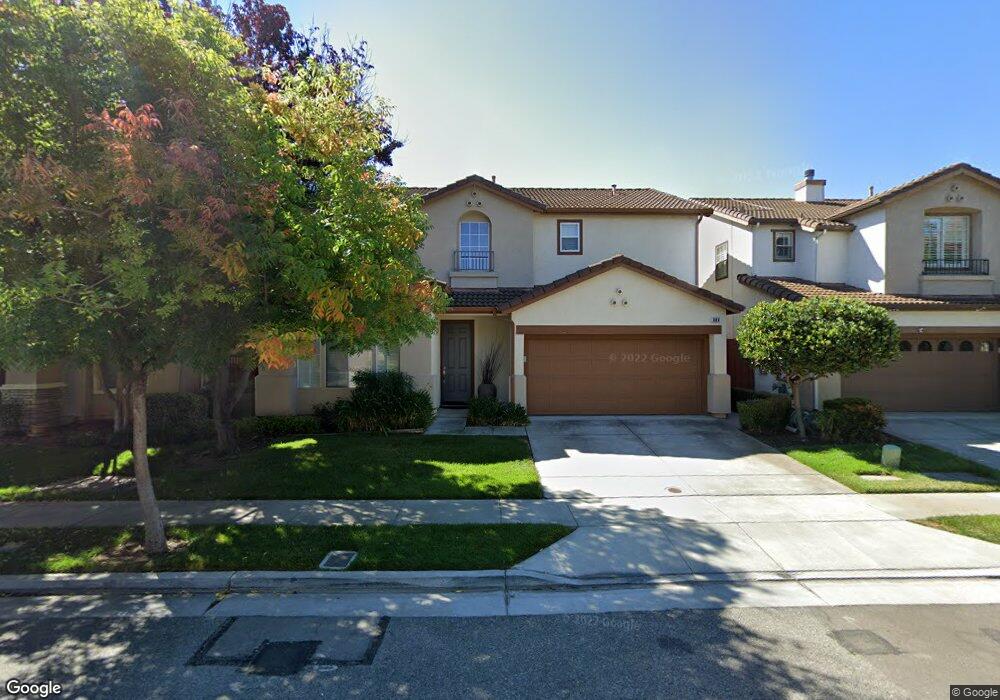
808 Pitkin Loop San Jose, CA 95125
South San Jose NeighborhoodEstimated Value: $1,817,611 - $2,266,000
4
Beds
3
Baths
2,429
Sq Ft
$835/Sq Ft
Est. Value
About This Home
This home is located at 808 Pitkin Loop, San Jose, CA 95125 and is currently estimated at $2,027,653, approximately $834 per square foot. 808 Pitkin Loop is a home located in Santa Clara County with nearby schools including Canoas Elementary School, John Muir Middle School, and Gunderson High School.
Ownership History
Date
Name
Owned For
Owner Type
Purchase Details
Closed on
Aug 4, 2010
Sold by
Meonske Ryan and Yoshioka Meonske Kelli
Bought by
Ho Thuy and Mai Jamie Phuong
Current Estimated Value
Home Financials for this Owner
Home Financials are based on the most recent Mortgage that was taken out on this home.
Original Mortgage
$470,000
Outstanding Balance
$310,243
Interest Rate
4.51%
Mortgage Type
New Conventional
Estimated Equity
$1,717,410
Purchase Details
Closed on
Mar 29, 2008
Sold by
Meonske Ryan and Yoshioka Meonske Kelli
Bought by
Meonske Ryan and Yoshioka Meonske Kelli
Purchase Details
Closed on
Jan 16, 2002
Sold by
Meonske Ryan and Meonske Kelli Yoshioka
Bought by
Meonske Ryan M and Yoshioka Meonske Kelli C
Home Financials for this Owner
Home Financials are based on the most recent Mortgage that was taken out on this home.
Original Mortgage
$251,625
Interest Rate
7.11%
Purchase Details
Closed on
Aug 5, 1999
Sold by
Kaufman & Broad South Bay Inc
Bought by
Meonske Ryan and Yoshioka Kelli
Home Financials for this Owner
Home Financials are based on the most recent Mortgage that was taken out on this home.
Original Mortgage
$260,000
Interest Rate
7.56%
Create a Home Valuation Report for This Property
The Home Valuation Report is an in-depth analysis detailing your home's value as well as a comparison with similar homes in the area
Home Values in the Area
Average Home Value in this Area
Purchase History
| Date | Buyer | Sale Price | Title Company |
|---|---|---|---|
| Ho Thuy | $720,000 | Old Republic Title Company | |
| Meonske Ryan | -- | None Available | |
| Meonske Ryan M | -- | Fidelity National Title Co | |
| Meonske Ryan | $479,500 | First American Title Guarant |
Source: Public Records
Mortgage History
| Date | Status | Borrower | Loan Amount |
|---|---|---|---|
| Open | Ho Thuy | $470,000 | |
| Previous Owner | Meonske Ryan M | $251,625 | |
| Previous Owner | Meonske Ryan | $260,000 |
Source: Public Records
Tax History
| Year | Tax Paid | Tax Assessment Tax Assessment Total Assessment is a certain percentage of the fair market value that is determined by local assessors to be the total taxable value of land and additions on the property. | Land | Improvement |
|---|---|---|---|---|
| 2025 | $12,526 | $922,437 | $507,340 | $415,097 |
| 2024 | $12,526 | $904,351 | $497,393 | $406,958 |
| 2023 | $12,271 | $886,620 | $487,641 | $398,979 |
| 2022 | $12,147 | $869,236 | $478,080 | $391,156 |
| 2021 | $11,862 | $852,193 | $468,706 | $383,487 |
| 2020 | $11,054 | $843,455 | $463,900 | $379,555 |
| 2019 | $10,816 | $826,917 | $454,804 | $372,113 |
| 2018 | $10,706 | $810,704 | $445,887 | $364,817 |
| 2017 | $10,618 | $794,809 | $437,145 | $357,664 |
| 2016 | $10,431 | $779,225 | $428,574 | $350,651 |
| 2015 | $10,361 | $767,521 | $422,137 | $345,384 |
| 2014 | $9,902 | $752,487 | $413,868 | $338,619 |
Source: Public Records
Map
Nearby Homes
- 2777 Rubino Cir
- 3097 Pearl Ave
- 908 Redbird Dr
- 867 Ironwood Dr
- 2991 Almaden Rd
- 1202 Foxworthy Ave
- 1148 Husted Ave
- 126 Mountain Springs Dr Unit 126
- 255 Mountain Springs Dr
- 1111 Mayette Ave
- 121 Mountain Springs Dr Unit 121
- 1036 Pascoe Ave
- 2540 Marsha Way
- 242 Mountain Springs Dr Unit 242
- 532A Mill Pond Dr Unit 532 A
- 2598 Cottle Ave
- 1126 Roy Ave
- 2212 Almaden Rd Unit A
- 491 Mill Pond Dr Unit 491
- 3120 Heather Ridge Dr
- 812 Pitkin Loop
- 804 Pitkin Loop
- 857 Dederick Ct
- 851 Dederick Ct
- 863 Dederick Ct
- 816 Pitkin Loop
- 800 Pitkin Loop
- 845 Dederick Ct
- 869 Dederick Ct
- 809 Pitkin Loop
- 805 Pitkin Loop
- 813 Pitkin Loop
- 820 Pitkin Loop
- 801 Pitkin Loop
- 839 Dederick Ct
- 2767 Pitkin Ct
- 824 Pitkin Loop
- 821 Pitkin Loop
- 856 Dederick Ct
- 833 Dederick Ct
Your Personal Tour Guide
Ask me questions while you tour the home.