Estimated Value: $409,000 - $521,000
Studio
--
Bath
1,107
Sq Ft
$404/Sq Ft
Est. Value
About This Home
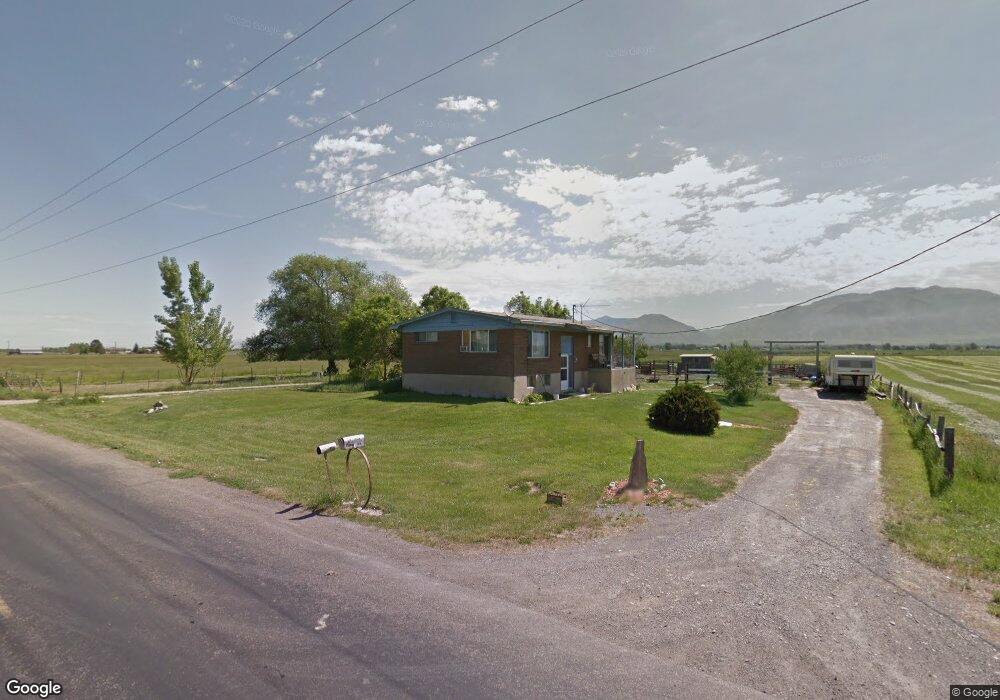
This home is located at 808 S 3200 W, Logan, UT 84321 and is currently estimated at $446,727, approximately $403 per square foot. 808 S 3200 W is a home with nearby schools including Mountainside School, South Cache Middle School, and Mountain Crest High School.
Ownership History
Date
Name
Owned For
Owner Type
Purchase Details
Closed on
Jan 5, 2021
Sold by
Souter Kent W and Souter Dixene P
Bought by
Wheeler Amber
Current Estimated Value
Home Financials for this Owner
Home Financials are based on the most recent Mortgage that was taken out on this home.
Original Mortgage
$205,000
Outstanding Balance
$182,124
Interest Rate
2.71%
Mortgage Type
New Conventional
Estimated Equity
$264,603
Purchase Details
Closed on
Oct 2, 2020
Sold by
Souter Kent W and Souter Dixene P
Bought by
Souter Kent W and Souter Dixene P
Purchase Details
Closed on
Nov 17, 2015
Sold by
Souter Kent W and Souter Dixene P
Bought by
Kent Souter Family Trust and Souter Dixene P
Purchase Details
Closed on
Jul 16, 2014
Sold by
Olsen Mitchell
Bought by
Souter Kent W and Souter Dixene P
Purchase Details
Closed on
Jun 24, 2009
Sold by
Olsen Gladys J
Bought by
Olsen Larry Carl and Olsen Linda B
Create a Home Valuation Report for This Property
The Home Valuation Report is an in-depth analysis detailing your home's value as well as a comparison with similar homes in the area
Home Values in the Area
Average Home Value in this Area
Purchase History
| Date | Buyer | Sale Price | Title Company |
|---|---|---|---|
| Wheeler Amber | -- | Hickman Land Title Logan | |
| Souter Kent W | -- | Accommodation | |
| Kent Souter Family Trust | -- | None Available | |
| Souter Kent W | -- | Heritage Title | |
| Olsen Mitchell | -- | Heritage Title | |
| Olsen Larry Carl | -- | None Available |
Source: Public Records
Mortgage History
| Date | Status | Borrower | Loan Amount |
|---|---|---|---|
| Open | Wheeler Amber | $205,000 |
Source: Public Records
Tax History
| Year | Tax Paid | Tax Assessment Tax Assessment Total Assessment is a certain percentage of the fair market value that is determined by local assessors to be the total taxable value of land and additions on the property. | Land | Improvement |
|---|---|---|---|---|
| 2025 | $1,449 | $233,475 | $0 | $0 |
| 2024 | $1,567 | $233,475 | $0 | $0 |
| 2023 | $1,663 | $232,045 | $0 | $0 |
| 2022 | $1,739 | $232,045 | $0 | $0 |
| 2021 | $1,445 | $295,980 | $80,000 | $215,980 |
| 2020 | $1,301 | $454,100 | $288,000 | $166,100 |
| 2019 | $1,376 | $454,100 | $288,000 | $166,100 |
| 2018 | $1,105 | $396,468 | $288,000 | $108,468 |
| 2017 | $1,092 | $102,700 | $0 | $0 |
| 2016 | $1,108 | $97,105 | $0 | $0 |
| 2015 | $1,045 | $97,010 | $0 | $0 |
| 2014 | $1,018 | $97,510 | $0 | $0 |
| 2013 | -- | $97,060 | $0 | $0 |
Source: Public Records
Map
Nearby Homes
- 3703 W 600 S
- 5800 W 1800 S
- 6044 W 1800 S
- 1788 W Rivergate Dr
- 1772 W Rivergate Dr
- 679 Trail Cir
- Redwood Plan at Rivergate - Logan
- Madison Plan at Rivergate - Logan
- Sitka Plan at Sugar Creek - Logan (Townhomes)
- Auburn Plan at Rivergate - Logan
- Hilldale Plan at Rivergate - Logan
- 2157 S 1580 W
- 1615 W Silver Canoe Way
- 1609 W Silver Canoe Way
- 539 S 1580 W Unit 121
- 552 S W Rivergate Dr
- 1603 W Silver Canoe Way
- 524 S W Rivergate Dr
- 552 Rivergate Dr
- 1506 Silver Canoe Loop
Your Personal Tour Guide
Ask me questions while you tour the home.