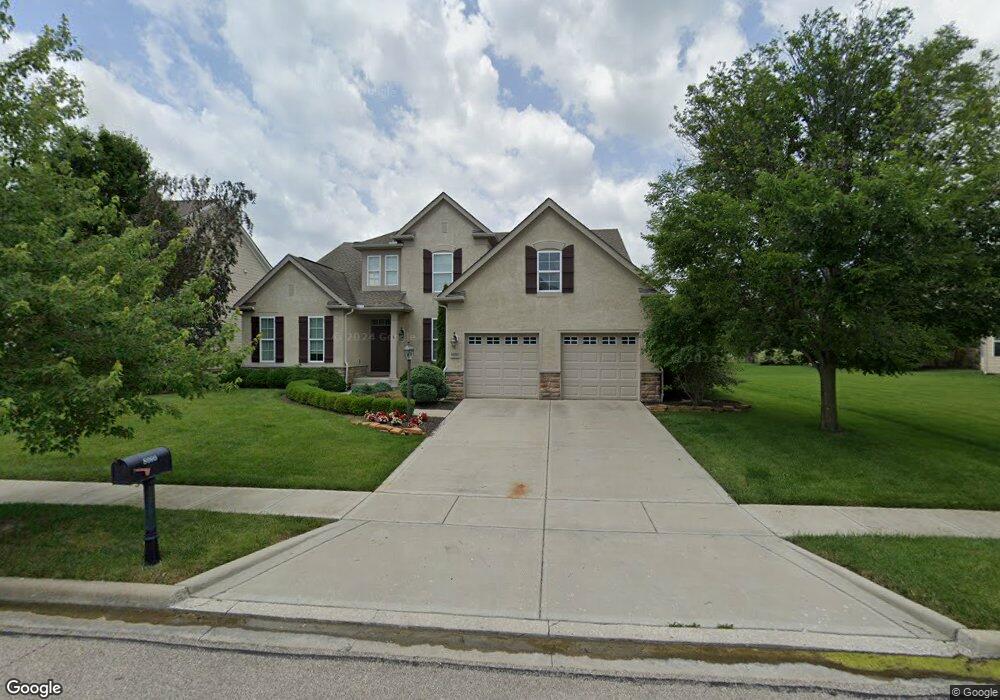
8080 Millway Loop Unit 3189 Powell, OH 43065
Estimated Value: $773,000 - $869,000
4
Beds
5
Baths
3,418
Sq Ft
$234/Sq Ft
Est. Value
About This Home
This home is located at 8080 Millway Loop Unit 3189, Powell, OH 43065 and is currently estimated at $801,199, approximately $234 per square foot. 8080 Millway Loop Unit 3189 is a home located in Delaware County with nearby schools including Liberty Tree Elementary School, Hyatts Middle School, and Olentangy Liberty High School.
Ownership History
Date
Name
Owned For
Owner Type
Purchase Details
Closed on
Sep 26, 2016
Sold by
Goodman Eric M
Bought by
Black Megan E and Black Kevin P
Current Estimated Value
Home Financials for this Owner
Home Financials are based on the most recent Mortgage that was taken out on this home.
Original Mortgage
$396,000
Outstanding Balance
$317,468
Interest Rate
3.46%
Mortgage Type
New Conventional
Estimated Equity
$483,731
Purchase Details
Closed on
Mar 29, 2011
Sold by
Fischer Single Family Homes Ii Llc
Bought by
Goodman Eric M
Home Financials for this Owner
Home Financials are based on the most recent Mortgage that was taken out on this home.
Original Mortgage
$315,600
Interest Rate
4.25%
Mortgage Type
New Conventional
Purchase Details
Closed on
Jun 16, 2010
Sold by
Virginia Homes Ltd
Bought by
Fischer Single Family Homes Ii Llc
Create a Home Valuation Report for This Property
The Home Valuation Report is an in-depth analysis detailing your home's value as well as a comparison with similar homes in the area
Home Values in the Area
Average Home Value in this Area
Purchase History
| Date | Buyer | Sale Price | Title Company |
|---|---|---|---|
| Black Megan E | $495,000 | Attorney | |
| Goodman Eric M | $394,500 | Homestead Title | |
| Fischer Single Family Homes Ii Llc | $85,000 | Stewart Title Oh |
Source: Public Records
Mortgage History
| Date | Status | Borrower | Loan Amount |
|---|---|---|---|
| Open | Black Megan E | $396,000 | |
| Previous Owner | Goodman Eric M | $315,600 |
Source: Public Records
Tax History
| Year | Tax Paid | Tax Assessment Tax Assessment Total Assessment is a certain percentage of the fair market value that is determined by local assessors to be the total taxable value of land and additions on the property. | Land | Improvement |
|---|---|---|---|---|
| 2024 | $14,568 | $232,550 | $43,580 | $188,970 |
| 2023 | $14,616 | $232,550 | $43,580 | $188,970 |
| 2022 | $13,251 | $173,010 | $29,750 | $143,260 |
| 2021 | $13,264 | $170,630 | $29,750 | $140,880 |
| 2020 | $13,305 | $170,630 | $29,750 | $140,880 |
| 2019 | $12,103 | $160,200 | $29,750 | $130,450 |
| 2018 | $12,224 | $160,200 | $29,750 | $130,450 |
| 2017 | $11,449 | $141,820 | $25,200 | $116,620 |
| 2016 | $11,505 | $141,820 | $25,200 | $116,620 |
| 2015 | $10,600 | $141,820 | $25,200 | $116,620 |
| 2014 | $10,722 | $141,820 | $25,200 | $116,620 |
| 2013 | $10,429 | $135,210 | $25,200 | $110,010 |
Source: Public Records
Map
Nearby Homes
- 8033 Hillingdon Dr Unit 8033
- 3443 Village Club Dr
- 3738 Pine Bank Dr
- 0 Liberty Rd Unit Tract 3
- 0 Liberty Rd Unit Tract 4
- 0 Liberty Rd Unit Tract 10
- 0 Liberty Rd Unit Tract 2
- 0 Liberty Rd Unit Tract 1
- 0 Liberty Rd Unit Tract 11
- 4816 Rutherford Rd
- 7941 Steitz Rd
- 3154 Mapex Ct
- 4532 Coyote Crossing
- 4530 Cascade Dr
- 8574 Trail Lake Dr
- 0 Home Rd Unit 225042181
- 8039 Farm Crossing Cir Unit 8039
- 8778 Linksway Dr
- 3296 Home Rd
- 5508 Fawnsbury Ct
- 8080 Millway Loop
- 8094 Millway Loop
- 8024 Millway Loop
- 8108 Millway Loop
- 8095 Millway Loop
- 8087 Wildflower Dr
- 8081 Millway Loop
- 8101 Wildflower Dr
- 8101 Wildflower Dr Unit 194
- 8069 Millway Loop
- 8008 Millway Loop
- 8109 Millway Loop
- 8109 Millway Loop Unit 175
- 8122 Millway Loop
- 8115 Wildflower Dr
- 8037 Millway Loop
- 8059 Millway Loop
- 8129 Wildflower Dr Unit 196
- 8023 Millway Loop
- 8123 Millway Loop
Your Personal Tour Guide
Ask me questions while you tour the home.