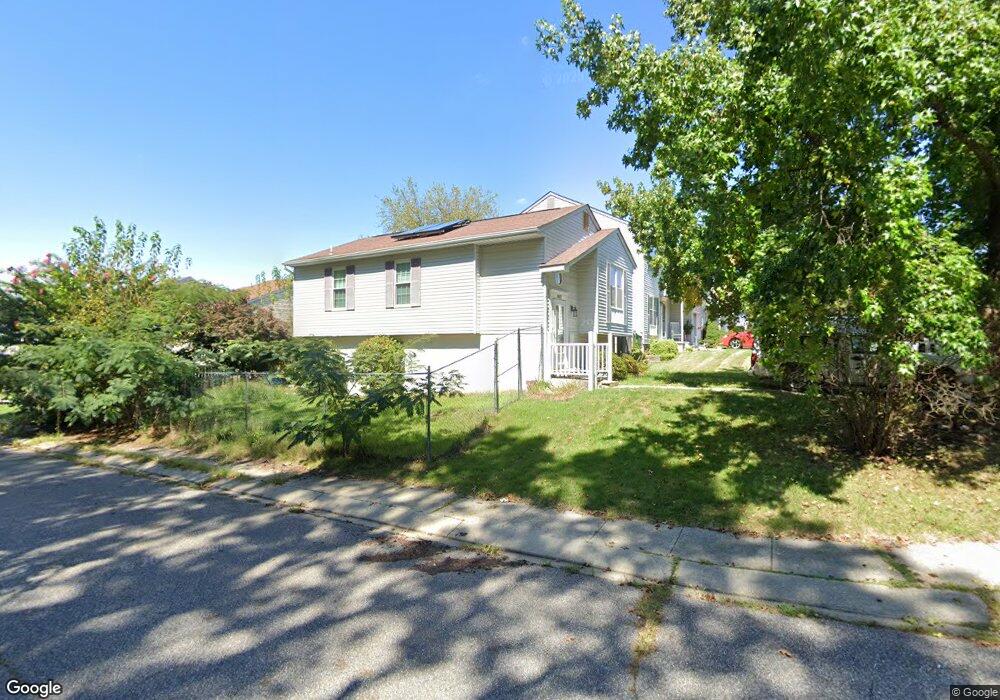
8082 Outing Ave Pasadena, MD 21122
Estimated Value: $370,000 - $415,000
3
Beds
2
Baths
935
Sq Ft
$416/Sq Ft
Est. Value
About This Home
This home is located at 8082 Outing Ave, Pasadena, MD 21122 and is currently estimated at $388,647, approximately $415 per square foot. 8082 Outing Ave is a home located in Anne Arundel County with nearby schools including Solley Elementary School, Northeast Middle School, and Northeast High School.
Ownership History
Date
Name
Owned For
Owner Type
Purchase Details
Closed on
May 24, 2019
Sold by
Stromberg Sharon and Wright Sharon
Bought by
Stromberg Sharon and Stromberg Christopher
Current Estimated Value
Home Financials for this Owner
Home Financials are based on the most recent Mortgage that was taken out on this home.
Original Mortgage
$206,250
Outstanding Balance
$134,252
Interest Rate
4.1%
Mortgage Type
New Conventional
Estimated Equity
$254,395
Purchase Details
Closed on
Aug 15, 2005
Sold by
Newman Enterprises Llc
Bought by
Wright Sharon
Home Financials for this Owner
Home Financials are based on the most recent Mortgage that was taken out on this home.
Original Mortgage
$204,000
Interest Rate
5.67%
Mortgage Type
New Conventional
Purchase Details
Closed on
Mar 24, 2004
Sold by
Artis Conrad
Bought by
Newman Enterprises Llc
Purchase Details
Closed on
Jul 22, 1997
Sold by
Talasky Todd C
Bought by
Artis Conrad and Artis Jennifer J
Create a Home Valuation Report for This Property
The Home Valuation Report is an in-depth analysis detailing your home's value as well as a comparison with similar homes in the area
Home Values in the Area
Average Home Value in this Area
Purchase History
| Date | Buyer | Sale Price | Title Company |
|---|---|---|---|
| Stromberg Sharon | -- | Title Source Inc | |
| Wright Sharon | $255,000 | -- | |
| Newman Enterprises Llc | $161,000 | -- | |
| Artis Conrad | $119,900 | -- |
Source: Public Records
Mortgage History
| Date | Status | Borrower | Loan Amount |
|---|---|---|---|
| Open | Stromberg Sharon | $206,250 | |
| Closed | Wright Sharon | $204,000 | |
| Closed | Wright Sharon | $51,000 | |
| Closed | Artis Conrad | -- |
Source: Public Records
Tax History
| Year | Tax Paid | Tax Assessment Tax Assessment Total Assessment is a certain percentage of the fair market value that is determined by local assessors to be the total taxable value of land and additions on the property. | Land | Improvement |
|---|---|---|---|---|
| 2025 | $3,195 | $280,733 | -- | -- |
| 2024 | $3,195 | $261,300 | $141,700 | $119,600 |
| 2023 | $3,101 | $250,900 | $0 | $0 |
| 2022 | $2,889 | $240,500 | $0 | $0 |
| 2020 | $2,753 | $226,200 | $0 | $0 |
| 2019 | $2,715 | $222,300 | $0 | $0 |
| 2018 | $2,215 | $218,400 | $111,700 | $106,700 |
| 2017 | $2,523 | $213,367 | $0 | $0 |
| 2016 | -- | $208,333 | $0 | $0 |
| 2015 | -- | $203,300 | $0 | $0 |
| 2014 | -- | $203,300 | $0 | $0 |
Source: Public Records
Map
Nearby Homes
- 8076 Outing Ave
- 8157 Poinsett Terrace
- 8097 Armiger Dr
- 8079 Armiger Dr
- 8012 Catherine Ave
- 578 Jersey Bronze Way
- 762 224th St
- 667 213th St
- 365 Hickory Nut Ct
- 675 211th St
- 750 215th St
- 668 209th St
- 928 Beales Trail
- 8194 Mountain Estate Ct
- 8214 Shady Nook Ct
- 7954 Cobbler Ln
- 719 207th St
- 772 209th St
- 3395 Littleton Way Unit 2G
- 3009 Noahs Way
Your Personal Tour Guide
Ask me questions while you tour the home.