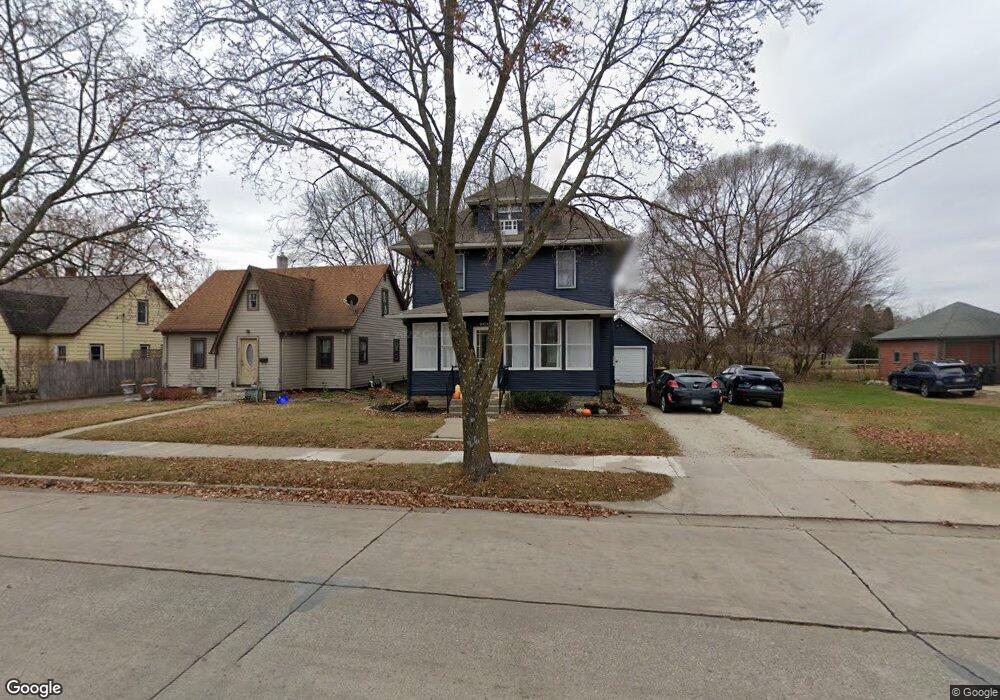
809 11th Ave NE Rochester, MN 55906
Quarry Hill West NeighborhoodEstimated Value: $270,268 - $298,000
3
Beds
2
Baths
2,388
Sq Ft
$117/Sq Ft
Est. Value
About This Home
This home is located at 809 11th Ave NE, Rochester, MN 55906 and is currently estimated at $280,317, approximately $117 per square foot. 809 11th Ave NE is a home located in Olmsted County with nearby schools including Jefferson Elementary School, Kellogg Middle School, and Century Senior High School.
Ownership History
Date
Name
Owned For
Owner Type
Purchase Details
Closed on
Oct 27, 2020
Sold by
Krengel Shaune Marie and Obryan Shaune Marie
Bought by
Obryan Allan Lee
Current Estimated Value
Purchase Details
Closed on
Aug 26, 2016
Sold by
Lange Colleen Colleen
Bought by
O'Bryan Allan Allan
Purchase Details
Closed on
Feb 5, 2009
Sold by
Fink David M and Fink Marci A
Bought by
Fagan Colleen R
Home Financials for this Owner
Home Financials are based on the most recent Mortgage that was taken out on this home.
Original Mortgage
$3,000
Interest Rate
5.2%
Mortgage Type
Unknown
Purchase Details
Closed on
Jul 18, 2006
Sold by
Haagenson Harold J and Haagenson Marcia L
Bought by
Fink David M and Fink Marci A
Home Financials for this Owner
Home Financials are based on the most recent Mortgage that was taken out on this home.
Original Mortgage
$153,122
Interest Rate
6.85%
Mortgage Type
VA
Create a Home Valuation Report for This Property
The Home Valuation Report is an in-depth analysis detailing your home's value as well as a comparison with similar homes in the area
Home Values in the Area
Average Home Value in this Area
Purchase History
| Date | Buyer | Sale Price | Title Company |
|---|---|---|---|
| Obryan Allan Lee | -- | None Available | |
| O'Bryan Allan Allan | $157,600 | -- | |
| Bryan Allan L O | $157,551 | Edina Realty Title Inc | |
| Fagan Colleen R | $138,500 | Multiple | |
| Fink David M | $149,900 | Executive Title Of Rochester |
Source: Public Records
Mortgage History
| Date | Status | Borrower | Loan Amount |
|---|---|---|---|
| Previous Owner | Fagan Colleen R | $3,000 | |
| Previous Owner | Fink David M | $153,122 |
Source: Public Records
Tax History Compared to Growth
Tax History
| Year | Tax Paid | Tax Assessment Tax Assessment Total Assessment is a certain percentage of the fair market value that is determined by local assessors to be the total taxable value of land and additions on the property. | Land | Improvement |
|---|---|---|---|---|
| 2024 | $3,316 | $237,200 | $40,000 | $197,200 |
| 2023 | $2,910 | $231,000 | $40,000 | $191,000 |
| 2022 | $2,670 | $224,700 | $40,000 | $184,700 |
| 2021 | $2,514 | $194,100 | $30,000 | $164,100 |
| 2020 | $2,490 | $182,500 | $20,000 | $162,500 |
| 2019 | $2,252 | $173,400 | $20,000 | $153,400 |
| 2018 | $749 | $157,600 | $20,000 | $137,600 |
| 2017 | $1,498 | $139,400 | $20,000 | $119,400 |
| 2016 | $1,526 | $98,400 | $13,300 | $85,100 |
| 2015 | $1,428 | $98,600 | $13,300 | $85,300 |
| 2014 | $1,396 | $99,200 | $13,300 | $85,900 |
| 2012 | -- | $99,700 | $13,336 | $86,364 |
Source: Public Records
Map
Nearby Homes
- 808 13th Ave NE
- 800 16th Ave NE
- 401 9th Ave NE
- 1500 Viola Rd NE
- 1227 19th Ave NE
- 1309 3rd St NE
- 1206 3rd St NE
- 317 15th Ave NE
- 1251 19th Ave NE
- 915 E Center St
- 302 17th Ave NE
- 815 E Center St
- 12 6th Ave SE
- 126 11th Ave SE
- 125 10th Ave SE
- 2106 8th Ave NE
- 1703 20th Ave NE
- 318 13th Ave SE
- 559 21st St NE
- 1646 2nd St SE
- 809 809 11th-Avenue-ne
- 803 11th Ave NE
- 803 803 11th-Avenue-ne
- 817 11th Ave NE
- 729 11th Ave NE
- 725 725 11th-Avenue-ne
- 821 11th Ave NE
- 721 11th Ave NE
- 808 11th Ave NE
- 802 11th Ave NE
- 827 827 11th-Avenue-ne
- 827 11th Ave NE
- 728 11th Ave NE
- 717 11th Ave NE
- 724 11th Ave NE
- 1024 9th St NE
- 720 11th Ave NE
- 828 11th Ave NE
- 831 11th Ave NE
- 713 11th Ave NE