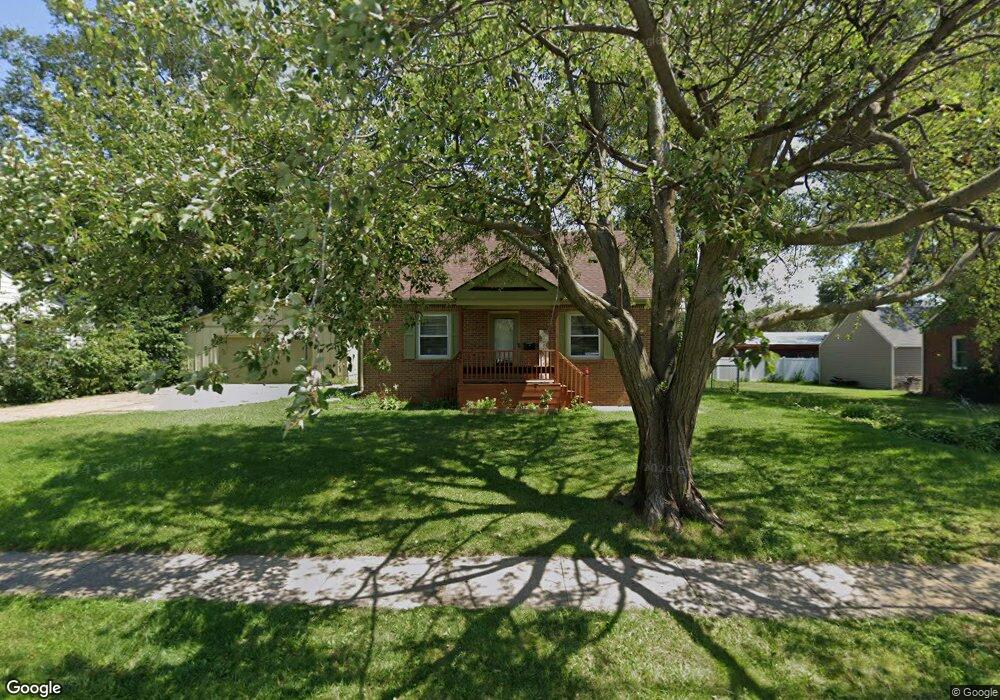
809 13th St West Des Moines, IA 50265
Estimated Value: $270,325 - $279,000
3
Beds
1
Bath
1,763
Sq Ft
$156/Sq Ft
Est. Value
About This Home
This home is located at 809 13th St, West Des Moines, IA 50265 and is currently estimated at $274,581, approximately $155 per square foot. 809 13th St is a home located in Polk County with nearby schools including Hillside Elementary School, Stilwell Junior High School, and Valley Southwoods Freshman High School.
Ownership History
Date
Name
Owned For
Owner Type
Purchase Details
Closed on
Apr 1, 2025
Sold by
Critelli Denise and Critelli Mark
Bought by
Uhl Brian and Miller Destinee
Current Estimated Value
Purchase Details
Closed on
May 31, 2023
Sold by
Family Pet Veterinary Center Inc
Bought by
Hook & Loop Inc
Create a Home Valuation Report for This Property
The Home Valuation Report is an in-depth analysis detailing your home's value as well as a comparison with similar homes in the area
Home Values in the Area
Average Home Value in this Area
Purchase History
| Date | Buyer | Sale Price | Title Company |
|---|---|---|---|
| Uhl Brian | $285,500 | None Listed On Document | |
| Uhl Brian | $285,500 | None Listed On Document | |
| Hook & Loop Inc | -- | None Listed On Document | |
| Hook & Loop Inc | -- | None Listed On Document |
Source: Public Records
Tax History Compared to Growth
Tax History
| Year | Tax Paid | Tax Assessment Tax Assessment Total Assessment is a certain percentage of the fair market value that is determined by local assessors to be the total taxable value of land and additions on the property. | Land | Improvement |
|---|---|---|---|---|
| 2025 | $3,516 | $256,700 | $69,600 | $187,100 |
| 2024 | $3,516 | $232,300 | $62,200 | $170,100 |
| 2023 | $3,784 | $232,300 | $62,200 | $170,100 |
| 2022 | $3,736 | $204,800 | $53,700 | $151,100 |
| 2021 | $3,572 | $204,800 | $53,700 | $151,100 |
| 2020 | $3,514 | $186,700 | $48,800 | $137,900 |
| 2019 | $3,302 | $186,700 | $48,800 | $137,900 |
| 2018 | $3,306 | $169,700 | $43,600 | $126,100 |
| 2017 | $3,180 | $169,700 | $43,600 | $126,100 |
| 2016 | $3,108 | $159,000 | $40,300 | $118,700 |
| 2015 | $3,108 | $159,000 | $40,300 | $118,700 |
| 2014 | $3,006 | $157,100 | $39,000 | $118,100 |
Source: Public Records
Map
Nearby Homes