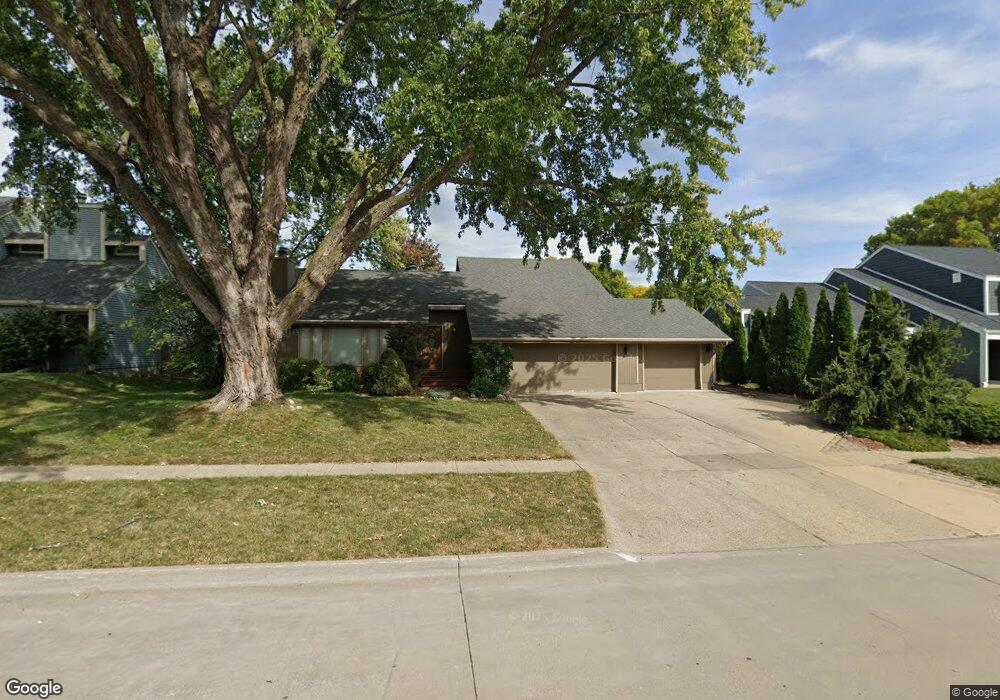
809 52nd Place West Des Moines, IA 50265
Estimated Value: $368,000 - $395,000
4
Beds
3
Baths
2,462
Sq Ft
$153/Sq Ft
Est. Value
About This Home
This home is located at 809 52nd Place, West Des Moines, IA 50265 and is currently estimated at $377,540, approximately $153 per square foot. 809 52nd Place is a home located in Polk County with nearby schools including Crossroads Park Elementary School, Valley Southwoods Freshman High School, and Indian Hills Junior High School.
Ownership History
Date
Name
Owned For
Owner Type
Purchase Details
Closed on
Apr 21, 2009
Sold by
Murray Michael B and Murray Bette J
Bought by
Gerritsen Torre
Current Estimated Value
Home Financials for this Owner
Home Financials are based on the most recent Mortgage that was taken out on this home.
Original Mortgage
$217,807
Outstanding Balance
$138,500
Interest Rate
5.05%
Mortgage Type
FHA
Estimated Equity
$239,040
Purchase Details
Closed on
Jan 30, 2002
Sold by
Westvold Brenda K
Bought by
Murray Michael B and Murray Bette J
Purchase Details
Closed on
Aug 7, 1997
Sold by
Parker Marc A
Bought by
Westvold Brenda K
Home Financials for this Owner
Home Financials are based on the most recent Mortgage that was taken out on this home.
Original Mortgage
$147,000
Interest Rate
7.25%
Mortgage Type
Balloon
Create a Home Valuation Report for This Property
The Home Valuation Report is an in-depth analysis detailing your home's value as well as a comparison with similar homes in the area
Home Values in the Area
Average Home Value in this Area
Purchase History
| Date | Buyer | Sale Price | Title Company |
|---|---|---|---|
| Gerritsen Torre | $221,500 | None Available | |
| Murray Michael B | $147,000 | -- | |
| Westvold Brenda K | $165,500 | -- |
Source: Public Records
Mortgage History
| Date | Status | Borrower | Loan Amount |
|---|---|---|---|
| Open | Gerritsen Torre | $217,807 | |
| Previous Owner | Westvold Brenda K | $147,000 |
Source: Public Records
Tax History Compared to Growth
Tax History
| Year | Tax Paid | Tax Assessment Tax Assessment Total Assessment is a certain percentage of the fair market value that is determined by local assessors to be the total taxable value of land and additions on the property. | Land | Improvement |
|---|---|---|---|---|
| 2025 | $5,226 | $361,500 | $63,100 | $298,400 |
| 2024 | $5,226 | $340,200 | $58,400 | $281,800 |
| 2023 | $5,298 | $340,200 | $58,400 | $281,800 |
| 2022 | $5,232 | $283,200 | $50,200 | $233,000 |
| 2021 | $5,140 | $283,200 | $50,200 | $233,000 |
| 2020 | $5,058 | $264,900 | $46,900 | $218,000 |
| 2019 | $4,806 | $264,900 | $46,900 | $218,000 |
| 2018 | $4,812 | $243,100 | $41,800 | $201,300 |
| 2017 | $4,450 | $243,100 | $41,800 | $201,300 |
| 2016 | $4,348 | $219,000 | $37,200 | $181,800 |
| 2015 | $4,348 | $219,000 | $37,200 | $181,800 |
| 2014 | $4,128 | $212,500 | $35,400 | $177,100 |
Source: Public Records
Map
Nearby Homes
- 756 Knolls Ct
- 5207 Pommel Place
- 724 Knolls Ct
- 5005 Colt Dr
- 5101 Dakota Dr
- 5255 Dakota Dr
- 1041 Bradford Place
- 1032 Bradford Place
- 4900 Dakota Dr
- 521 51st St
- 608 53rd St
- 513 52nd St
- 4917 Westbrooke Place
- 4817 Westbrooke Place
- 1067 Bradford Place
- 455 52nd Place
- 813 56th St
- 4906 W Park Dr Unit J2
- 4918 W Park Dr Unit G3
- 636 47th St