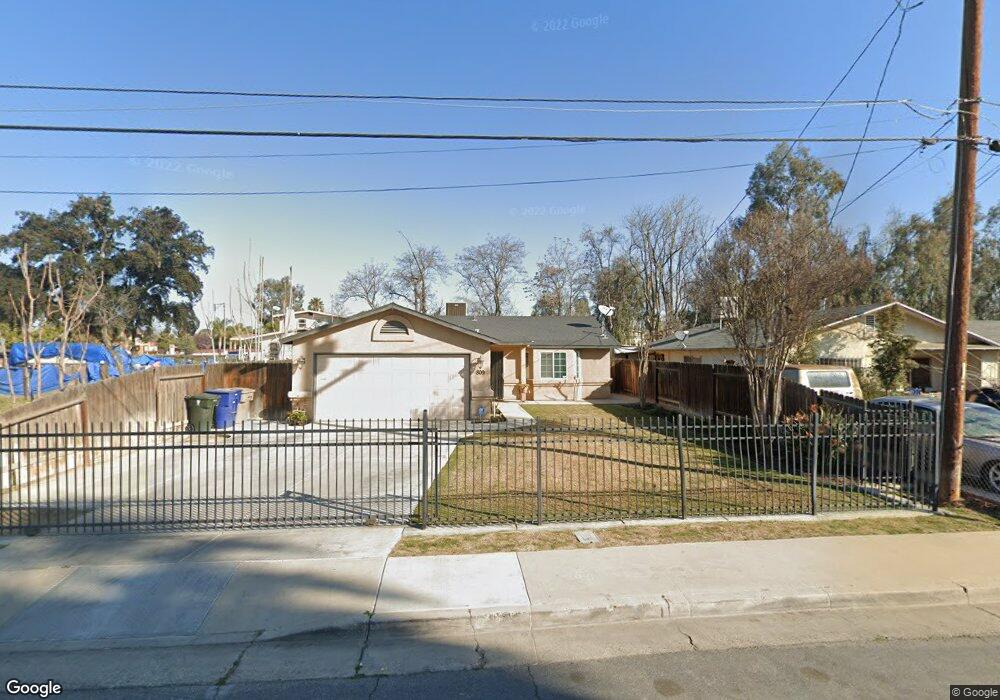
809 Bradshaw St Bakersfield, CA 93307
Estimated Value: $258,000 - $325,330
4
Beds
2
Baths
1,359
Sq Ft
$209/Sq Ft
Est. Value
About This Home
This home is located at 809 Bradshaw St, Bakersfield, CA 93307 and is currently estimated at $284,333, approximately $209 per square foot. 809 Bradshaw St is a home located in Kern County with nearby schools including Casa Loma Elementary School, Sequoia Middle School, and Mira Monte High School.
Ownership History
Date
Name
Owned For
Owner Type
Purchase Details
Closed on
Jul 13, 2021
Sold by
Vela Rosanne M and Vargas Jose Vela
Bought by
Vela Rosanne M and Vargas Jose Vela
Current Estimated Value
Home Financials for this Owner
Home Financials are based on the most recent Mortgage that was taken out on this home.
Original Mortgage
$149,500
Interest Rate
2.9%
Mortgage Type
New Conventional
Purchase Details
Closed on
Jun 21, 2006
Sold by
Vela Jose M and Vela Rosanne
Bought by
Vela Jose and Vela Rosanne M
Home Financials for this Owner
Home Financials are based on the most recent Mortgage that was taken out on this home.
Original Mortgage
$175,000
Interest Rate
6.63%
Mortgage Type
Construction
Purchase Details
Closed on
Oct 27, 2005
Sold by
Cornejo Annie and The Annie Cornejo Living Trust
Bought by
Vela Jose M and Vela Roseanne
Purchase Details
Closed on
Mar 24, 2004
Sold by
Cornejo James Michael and Cornejo James M
Bought by
Cornejo Annie
Purchase Details
Closed on
Jul 17, 2003
Sold by
Cornejo Annie
Bought by
Cornejo Annie and Cornejo James Michael
Create a Home Valuation Report for This Property
The Home Valuation Report is an in-depth analysis detailing your home's value as well as a comparison with similar homes in the area
Purchase History
| Date | Buyer | Sale Price | Title Company |
|---|---|---|---|
| Vela Rosanne M | -- | Title365 | |
| Vela Jose | -- | Chicago Title Company | |
| Vela Jose M | -- | -- | |
| Cornejo Annie | -- | -- | |
| Cornejo Annie | -- | -- |
Source: Public Records
Mortgage History
| Date | Status | Borrower | Loan Amount |
|---|---|---|---|
| Closed | Vela Rosanne M | $149,500 | |
| Closed | Vela Jose | $175,000 |
Source: Public Records
Tax History
| Year | Tax Paid | Tax Assessment Tax Assessment Total Assessment is a certain percentage of the fair market value that is determined by local assessors to be the total taxable value of land and additions on the property. | Land | Improvement |
|---|---|---|---|---|
| 2025 | $3,214 | $235,000 | $62,000 | $173,000 |
| 2024 | $3,101 | $220,000 | $55,000 | $165,000 |
| 2023 | $3,101 | $212,000 | $53,000 | $159,000 |
| 2022 | $3,044 | $209,000 | $39,000 | $170,000 |
| 2021 | $2,821 | $196,000 | $49,000 | $147,000 |
| 2020 | $2,456 | $167,000 | $37,000 | $130,000 |
| 2019 | $2,603 | $180,000 | $50,000 | $130,000 |
| 2018 | $2,572 | $179,000 | $45,000 | $134,000 |
| 2017 | $2,294 | $154,000 | $39,000 | $115,000 |
| 2016 | $2,184 | $158,000 | $40,000 | $118,000 |
| 2015 | $1,721 | $163,000 | $41,000 | $122,000 |
| 2014 | $1,992 | $176,000 | $44,000 | $132,000 |
Source: Public Records
Map
Nearby Homes
- 2329 Watts Dr
- 1007 Watts Dr
- 3517 Lotus Ln
- 1011 Casa Grande St
- 1420 Reese Ave
- 900 E Planz Rd
- 1303 Erie St
- 0 E Planz Rd
- 3501 Oliver St
- 3308 Hale St
- 1134 Lomita Dr
- 3604 Elda Ave
- 3621 Oliver St
- 2101 E Belle Terrace
- 400 E Belle Terrace
- 1213 Feliz Dr
- 305 Madison St
- 1012 Feliz Dr
- 600 Lawson Rd
- 1001 Padre St
- 813 Bradshaw St
- 817 Bradshaw St
- 1903 Lotus Ln
- 801 Bradshaw St
- 1831 Lotus Ln
- 821 Bradshaw St
- 802 Bradshaw St
- 804 Bradshaw St
- 806 Bradshaw St
- 808 Bradshaw St
- 1801 Lotus Ln
- 800 Bradshaw St
- 810 Bradshaw St
- 1900 Lotus Ln
- 1904 Lotus Ln
- 812 Bradshaw St
- 901 Bradshaw St
- 814 Bradshaw St
- 805 Melwood St
- 807 Melwood St
Your Personal Tour Guide
Ask me questions while you tour the home.