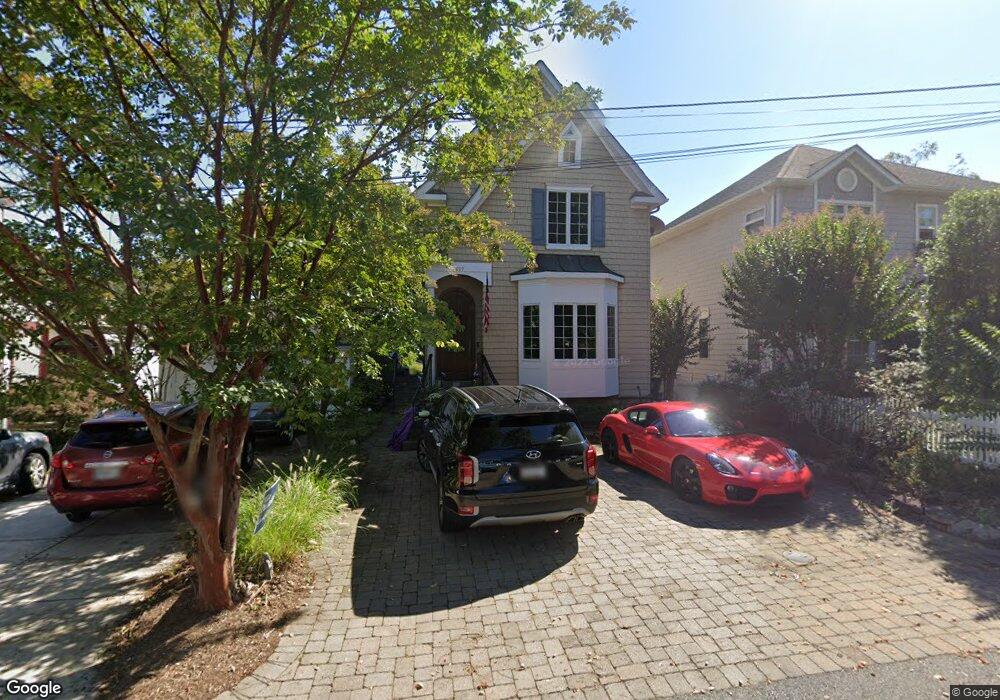
809 Chester Ave Annapolis, MD 21403
Eastport NeighborhoodEstimated Value: $1,729,000 - $2,542,413
Studio
3
Baths
1,834
Sq Ft
$1,190/Sq Ft
Est. Value
About This Home
This home is located at 809 Chester Ave, Annapolis, MD 21403 and is currently estimated at $2,182,804, approximately $1,190 per square foot. 809 Chester Ave is a home located in Anne Arundel County with nearby schools including Eastport Elementary School, Annapolis Middle School, and Annapolis High School.
Ownership History
Date
Name
Owned For
Owner Type
Purchase Details
Closed on
Jun 7, 2021
Sold by
Tipton Slaughter Dean and Hughes Patricia
Bought by
Patricia Hughes Slaughter Revocable Trust
Current Estimated Value
Purchase Details
Closed on
Aug 12, 2011
Sold by
Slaughter Dean T
Bought by
Sears Brian
Purchase Details
Closed on
Aug 11, 2011
Sold by
Slaughter Dean T
Bought by
Sears Brian
Purchase Details
Closed on
Jan 3, 2006
Sold by
Kosmas Lawrence J
Bought by
Slaughter Dean T
Home Financials for this Owner
Home Financials are based on the most recent Mortgage that was taken out on this home.
Original Mortgage
$650,000
Interest Rate
7.5%
Mortgage Type
Purchase Money Mortgage
Create a Home Valuation Report for This Property
The Home Valuation Report is an in-depth analysis detailing your home's value as well as a comparison with similar homes in the area
Home Values in the Area
Average Home Value in this Area
Purchase History
| Date | Buyer | Sale Price | Title Company |
|---|---|---|---|
| Patricia Hughes Slaughter Revocable Trust | -- | None Listed On Document | |
| Slaughter Dean Tipton | -- | None Listed On Document | |
| Sears Brian | $250,000 | -- | |
| Sears Brian | $250,000 | -- | |
| Slaughter Dean T | $810,000 | -- | |
| Slaughter Dean T | $810,000 | -- |
Source: Public Records
Mortgage History
| Date | Status | Borrower | Loan Amount |
|---|---|---|---|
| Previous Owner | Slaughter Dean T | $650,000 | |
| Previous Owner | Slaughter Dean T | $350,000 |
Source: Public Records
Tax History
| Year | Tax Paid | Tax Assessment Tax Assessment Total Assessment is a certain percentage of the fair market value that is determined by local assessors to be the total taxable value of land and additions on the property. | Land | Improvement |
|---|---|---|---|---|
| 2025 | $23,443 | $1,926,500 | -- | -- |
| 2024 | $23,443 | $1,727,500 | $0 | $0 |
| 2023 | $19,715 | $1,528,500 | $1,147,300 | $381,200 |
| 2022 | $21,423 | $1,520,467 | $0 | $0 |
| 2021 | $21,212 | $1,512,433 | $0 | $0 |
| 2020 | $21,212 | $1,504,400 | $1,147,300 | $357,100 |
| 2019 | $21,220 | $1,503,933 | $0 | $0 |
| 2018 | $20,913 | $1,503,467 | $0 | $0 |
| 2017 | $19,614 | $1,503,000 | $0 | $0 |
| 2016 | -- | $1,476,167 | $0 | $0 |
| 2015 | -- | $1,449,333 | $0 | $0 |
| 2014 | -- | $1,422,500 | $0 | $0 |
Source: Public Records
Map
Nearby Homes
- 509 Chesapeake Ave
- 936 Bay Ridge Ave Unit 306
- 400 Chesapeake Ave Unit 2-101
- 790 Fairview Ave Unit 790 C
- 148 Jefferson St
- 316 Burnside St Unit 203
- 301 Burnside St
- 289 State St Unit 4
- 769 Fairview Ave Unit 769B
- 287 State St Unit 2
- 1014 Wells Ave
- 312 Severn Ave
- 312 Severn Ave Unit W-401
- 312 Severn Ave
- 755 Fairview Ave Unit 755 D
- 200 Chesapeake Ave
- 3 Klakring Ct
- 120 Chesapeake Ave
- 1109 Boucher Ave
- 32 Boucher Place
Your Personal Tour Guide
Ask me questions while you tour the home.