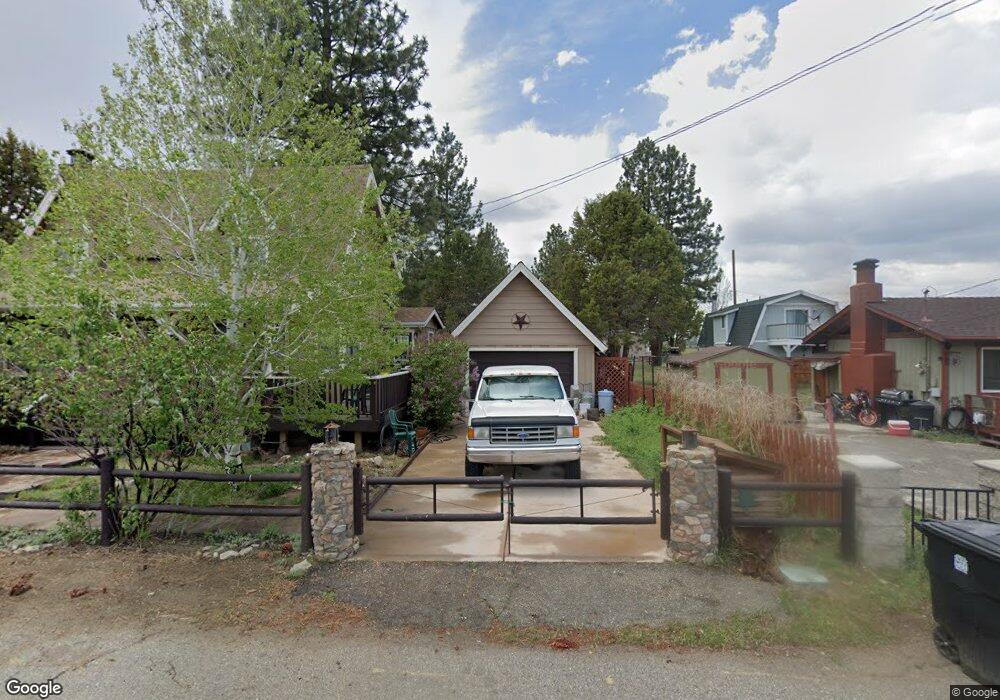
809 D Ln Big Bear City, CA 92314
Estimated Value: $422,006 - $501,000
2
Beds
2
Baths
1,676
Sq Ft
$278/Sq Ft
Est. Value
About This Home
This home is located at 809 D Ln, Big Bear City, CA 92314 and is currently estimated at $466,002, approximately $278 per square foot. 809 D Ln is a home located in San Bernardino County with nearby schools including Baldwin Lane Elementary School, Big Bear Middle School, and Big Bear High School.
Ownership History
Date
Name
Owned For
Owner Type
Purchase Details
Closed on
Mar 19, 2005
Sold by
Garlick Carl D
Bought by
Garlick Carl D and Mccoy Dana
Current Estimated Value
Purchase Details
Closed on
Jun 17, 2003
Sold by
Mccoy Dana
Bought by
Garlick Carl D
Purchase Details
Closed on
May 8, 2003
Sold by
Jones James
Bought by
Garlick Carl D
Purchase Details
Closed on
Oct 19, 2001
Sold by
Murillo Irma
Bought by
Jones James and Jones Karen
Home Financials for this Owner
Home Financials are based on the most recent Mortgage that was taken out on this home.
Original Mortgage
$131,000
Interest Rate
6.57%
Purchase Details
Closed on
May 7, 1999
Sold by
Hebert Victor J Tr
Bought by
Murillo Irma
Home Financials for this Owner
Home Financials are based on the most recent Mortgage that was taken out on this home.
Original Mortgage
$100,800
Interest Rate
5.67%
Create a Home Valuation Report for This Property
The Home Valuation Report is an in-depth analysis detailing your home's value as well as a comparison with similar homes in the area
Home Values in the Area
Average Home Value in this Area
Purchase History
| Date | Buyer | Sale Price | Title Company |
|---|---|---|---|
| Garlick Carl D | -- | -- | |
| Garlick Carl D | -- | Fidelity National Title | |
| Garlick Carl D | $188,500 | Fidelity National Title | |
| Jones James | -- | Fidelity National Title | |
| Jones James | $146,000 | First American Title | |
| Murillo Irma | $126,000 | Commonwealth Land Title |
Source: Public Records
Mortgage History
| Date | Status | Borrower | Loan Amount |
|---|---|---|---|
| Previous Owner | Jones James | $131,000 | |
| Previous Owner | Murillo Irma | $100,800 |
Source: Public Records
Tax History
| Year | Tax Paid | Tax Assessment Tax Assessment Total Assessment is a certain percentage of the fair market value that is determined by local assessors to be the total taxable value of land and additions on the property. | Land | Improvement |
|---|---|---|---|---|
| 2025 | $3,820 | $239,577 | $53,921 | $185,656 |
| 2024 | $3,653 | $234,880 | $52,864 | $182,016 |
| 2023 | $3,548 | $230,274 | $51,827 | $178,447 |
| 2022 | $3,420 | $225,759 | $50,811 | $174,948 |
| 2021 | $3,349 | $221,333 | $49,815 | $171,518 |
| 2020 | $3,363 | $219,063 | $49,304 | $169,759 |
| 2019 | $3,281 | $214,767 | $48,337 | $166,430 |
| 2018 | $3,160 | $210,556 | $47,389 | $163,167 |
| 2017 | $3,076 | $206,428 | $46,460 | $159,968 |
| 2016 | $3,001 | $202,380 | $45,549 | $156,831 |
| 2015 | $2,958 | $199,340 | $44,865 | $154,475 |
| 2014 | $2,656 | $172,800 | $33,900 | $138,900 |
Source: Public Records
Map
Nearby Homes
- 0 Avenue C Unit 26404891
- 0 Avenue C Unit SR24250416
- 0 Avenue C Unit SR24250475
- 836 D Ln
- 858 Norwood Ln
- 933 East Ln
- 0 Erwin Ranch Rd Unit 32500478
- 2001 State Ln
- 0 State Ln Unit SR25146675
- 1044 G Ln
- 1037 H Ln
- 964 Pine Ln
- 949 Pine Ln
- 849 Hemlock Ln
- 2737 Cedar Ln
- 0 Hemlock Ln Unit 32406193
- 0 Hemlock Ln Unit IG25049783
- 0 Hemlock Ln Unit OC26025819
- 2767 Cedar Ln
- 936 Pinon Ln
Your Personal Tour Guide
Ask me questions while you tour the home.