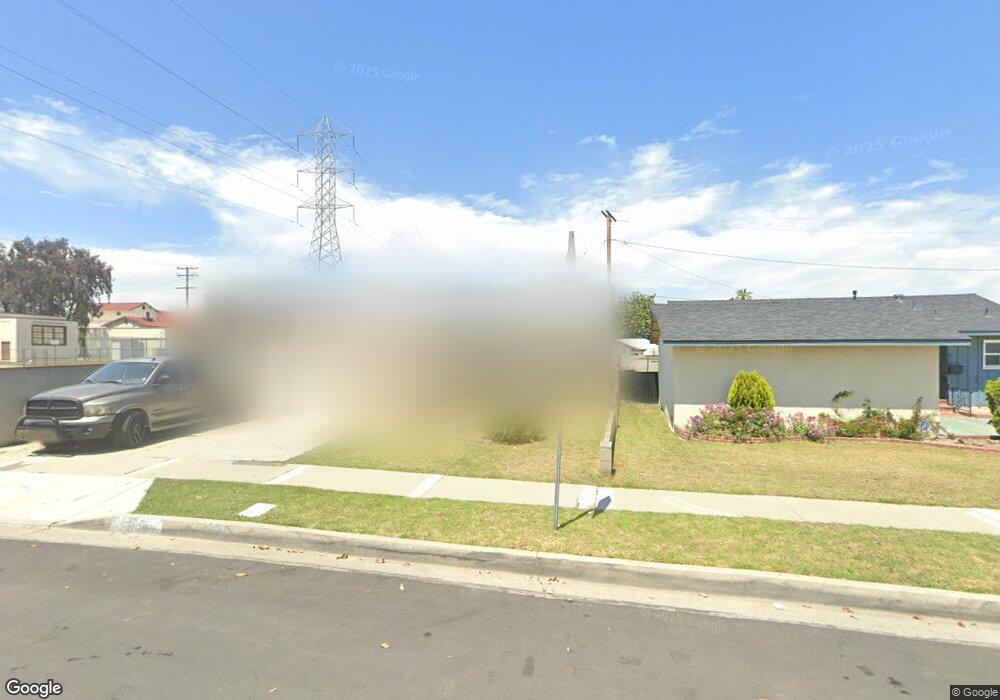
809 E Lennon St Compton, CA 90220
West Compton NeighborhoodEstimated Value: $567,556 - $681,000
3
Beds
2
Baths
1,036
Sq Ft
$608/Sq Ft
Est. Value
About This Home
This home is located at 809 E Lennon St, Compton, CA 90220 and is currently estimated at $629,889, approximately $608 per square foot. 809 E Lennon St is a home located in Los Angeles County with nearby schools including McKinley Elementary School, Enterprise Middle School, and Compton High School.
Ownership History
Date
Name
Owned For
Owner Type
Purchase Details
Closed on
Oct 12, 2017
Sold by
Armstrong George V
Bought by
Armstrong George V and George Armstrong Living Trust
Current Estimated Value
Purchase Details
Closed on
Nov 12, 1997
Sold by
Armstrong Benella
Bought by
Armstrong George
Home Financials for this Owner
Home Financials are based on the most recent Mortgage that was taken out on this home.
Original Mortgage
$94,400
Outstanding Balance
$14,934
Interest Rate
6.87%
Estimated Equity
$614,955
Purchase Details
Closed on
Jul 10, 1997
Sold by
Miller Charmaine
Bought by
Armstrong George
Purchase Details
Closed on
May 21, 1997
Sold by
Hill Marlyn F
Bought by
Miller Charmaine
Purchase Details
Closed on
Jul 22, 1996
Sold by
Hill Thomas
Bought by
Smart Marilyn Faye and Hill Marlyn Faye
Home Financials for this Owner
Home Financials are based on the most recent Mortgage that was taken out on this home.
Original Mortgage
$81,250
Interest Rate
8.39%
Create a Home Valuation Report for This Property
The Home Valuation Report is an in-depth analysis detailing your home's value as well as a comparison with similar homes in the area
Home Values in the Area
Average Home Value in this Area
Purchase History
| Date | Buyer | Sale Price | Title Company |
|---|---|---|---|
| Armstrong George V | -- | None Available | |
| Armstrong George | -- | Landsafe Title | |
| Armstrong George | -- | Fidelity National Title Ins | |
| Miller Charmaine | -- | -- | |
| Smart Marilyn Faye | -- | Commonwealth Land Title |
Source: Public Records
Mortgage History
| Date | Status | Borrower | Loan Amount |
|---|---|---|---|
| Open | Armstrong George | $94,400 | |
| Previous Owner | Smart Marilyn Faye | $81,250 |
Source: Public Records
Tax History
| Year | Tax Paid | Tax Assessment Tax Assessment Total Assessment is a certain percentage of the fair market value that is determined by local assessors to be the total taxable value of land and additions on the property. | Land | Improvement |
|---|---|---|---|---|
| 2025 | $2,835 | $196,210 | $98,981 | $97,229 |
| 2024 | $2,835 | $192,364 | $97,041 | $95,323 |
| 2023 | $2,797 | $188,593 | $95,139 | $93,454 |
| 2022 | $2,609 | $184,896 | $93,274 | $91,622 |
| 2021 | $2,649 | $181,272 | $91,446 | $89,826 |
| 2019 | $2,571 | $175,897 | $88,735 | $87,162 |
| 2018 | $2,480 | $172,449 | $86,996 | $85,453 |
| 2017 | $2,397 | $169,069 | $85,291 | $83,778 |
| 2016 | $2,339 | $165,755 | $83,619 | $82,136 |
| 2015 | $2,212 | $163,266 | $82,363 | $80,903 |
| 2014 | $2,171 | $160,069 | $80,750 | $79,319 |
Source: Public Records
Map
Nearby Homes
- 14433 S Cahita Ave
- 14609 S Cahita Ave
- 14426 S Cahita Ave
- 14328 S Cahita Ave
- 1003 E 149th St
- 14603 S Aprilia Ave
- 801 E Compton Blvd
- 14502 S Keene Ave
- 14513 S Loness Ave
- 638 E 137th St
- 2215 W 153rd St
- 642 E 136th St
- 15520 S Mckinley Ave
- 13918 S Hillford Ave
- 1616 W Palmer St
- 15328 S San Pedro St
- 505 E 154th St
- 2202 W 153rd St
- 14016 S Albertson Ave
- 1706 W 137th St
- 813 E Lennon St
- 800 E 146th St
- 819 E Lennon St
- 806 E 146th St
- 14511 S Clymar Ave
- 808 E Lennon St
- 823 E Lennon St
- 814 E Lennon St
- 810 E 146th St
- 822 E Lennon St
- 14507 S Clymar Ave
- 829 E Lennon St
- 14605 S Clymar Ave
- 14524 S Stanford Ave
- 809 E 146th St
- 818 E 146th St
- 14503 S Clymar Ave
- 835 E Lennon St
- 14609 S Clymar Ave
- 14532 S Stanford Ave
Your Personal Tour Guide
Ask me questions while you tour the home.