Estimated Value: $117,885 - $156,000
Studio
1
Bath
2,141
Sq Ft
$60/Sq Ft
Est. Value
About This Home
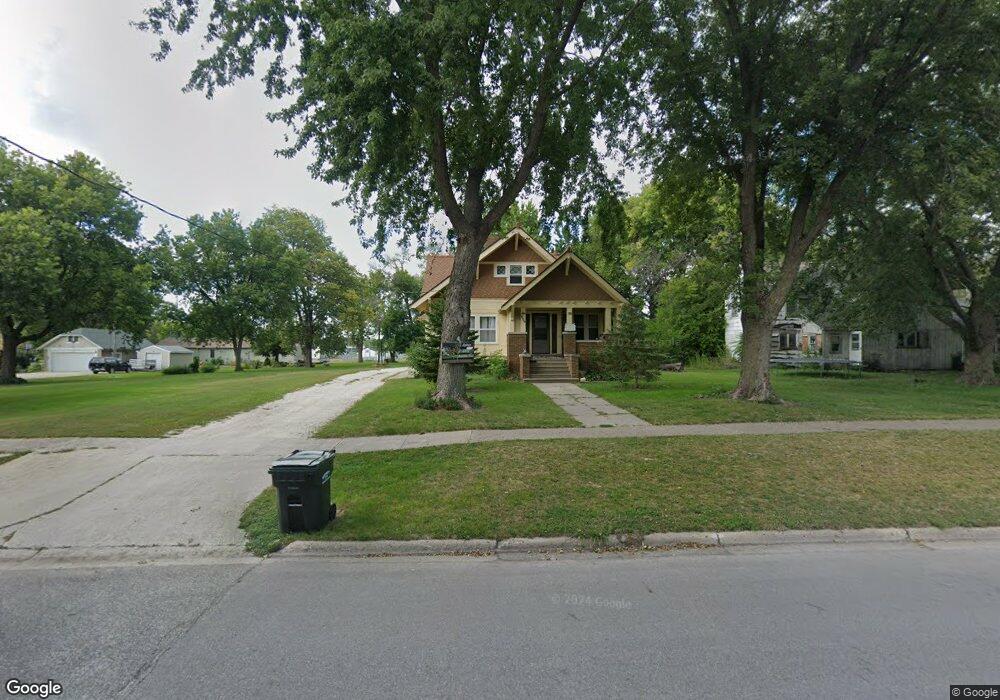
This home is located at 809 Elm St, Rolfe, IA 50581 and is currently estimated at $128,971, approximately $60 per square foot. 809 Elm St is a home located in Pocahontas County with nearby schools including Pocahontas Area Elementary School and Pocahontas Area Middle School / High School.
Ownership History
Date
Name
Owned For
Owner Type
Purchase Details
Closed on
Sep 17, 2019
Sold by
Christensen Janice M
Bought by
Jenney Jessica M
Current Estimated Value
Home Financials for this Owner
Home Financials are based on the most recent Mortgage that was taken out on this home.
Original Mortgage
$90,000
Outstanding Balance
$78,994
Interest Rate
3.7%
Mortgage Type
Construction
Estimated Equity
$49,977
Purchase Details
Closed on
Mar 7, 2019
Bought by
Christensen Janice M
Create a Home Valuation Report for This Property
The Home Valuation Report is an in-depth analysis detailing your home's value as well as a comparison with similar homes in the area
Purchase History
| Date | Buyer | Sale Price | Title Company |
|---|---|---|---|
| Jenney Jessica M | $89,875 | -- | |
| Christensen Janice M | -- | -- |
Source: Public Records
Mortgage History
| Date | Status | Borrower | Loan Amount |
|---|---|---|---|
| Open | Jenney Jessica M | $90,000 |
Source: Public Records
Tax History
| Year | Tax Paid | Tax Assessment Tax Assessment Total Assessment is a certain percentage of the fair market value that is determined by local assessors to be the total taxable value of land and additions on the property. | Land | Improvement |
|---|---|---|---|---|
| 2025 | $1,198 | $79,232 | $5,638 | $73,594 |
| 2024 | $1,094 | $73,260 | $5,638 | $67,622 |
| 2023 | $1,200 | $73,260 | $5,638 | $67,622 |
| 2022 | $1,298 | $74,192 | $5,638 | $68,554 |
| 2021 | $1,298 | $74,192 | $5,638 | $68,554 |
| 2020 | $1,030 | $60,807 | $5,638 | $55,169 |
| 2019 | $1,130 | $60,969 | $0 | $0 |
| 2018 | $1,046 | $60,969 | $0 | $0 |
| 2017 | $1,046 | $53,259 | $0 | $0 |
| 2016 | $874 | $53,259 | $0 | $0 |
| 2015 | $874 | $52,797 | $0 | $0 |
| 2014 | $836 | $52,797 | $0 | $0 |
Source: Public Records
Map
Nearby Homes
Your Personal Tour Guide
Ask me questions while you tour the home.