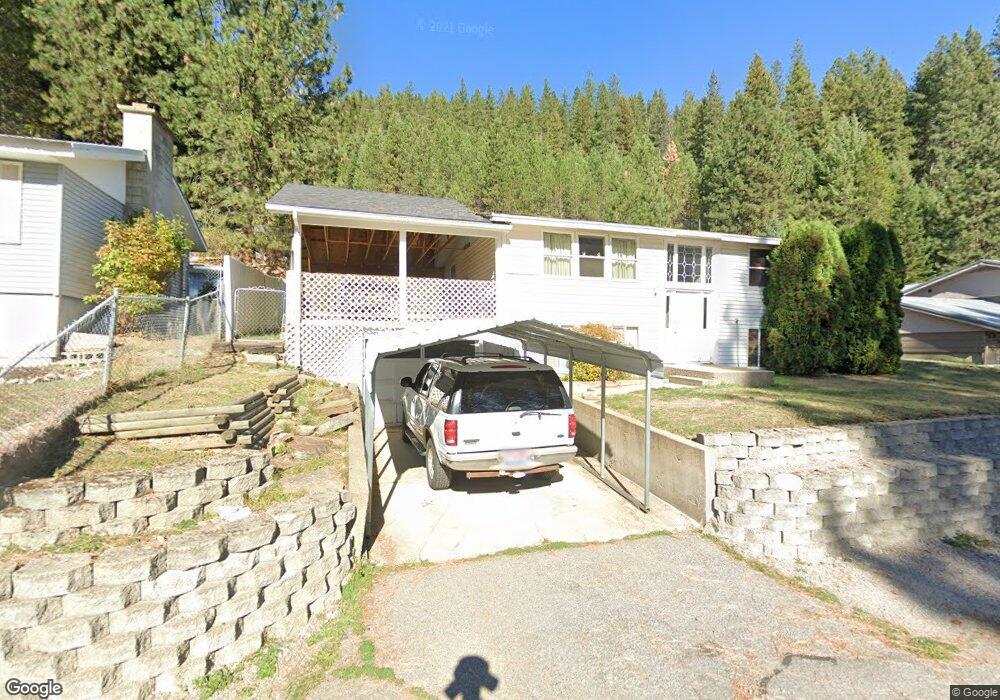
809 Fir St Mullan, ID 83846
Estimated Value: $284,000 - $344,000
4
Beds
2
Baths
1,776
Sq Ft
$172/Sq Ft
Est. Value
About This Home
This home is located at 809 Fir St, Mullan, ID 83846 and is currently estimated at $305,924, approximately $172 per square foot. 809 Fir St is a home located in Shoshone County with nearby schools including John Mullan Elementary School and Mullan School District.
Ownership History
Date
Name
Owned For
Owner Type
Purchase Details
Closed on
Jul 19, 2023
Sold by
Anderson Cathy Lynn and Foster Dawn Marie
Bought by
Rasmussen Kami and Rasmussen Griffyn
Current Estimated Value
Home Financials for this Owner
Home Financials are based on the most recent Mortgage that was taken out on this home.
Original Mortgage
$197,471
Outstanding Balance
$192,654
Interest Rate
6.67%
Mortgage Type
FHA
Estimated Equity
$113,270
Purchase Details
Closed on
Dec 16, 2022
Sold by
Jones Tammy S
Bought by
Anderson Cathy Lynn and Foster Dawn Marie
Create a Home Valuation Report for This Property
The Home Valuation Report is an in-depth analysis detailing your home's value as well as a comparison with similar homes in the area
Home Values in the Area
Average Home Value in this Area
Purchase History
| Date | Buyer | Sale Price | Title Company |
|---|---|---|---|
| Rasmussen Kami | -- | Flying S Title And Escrow Of I | |
| Anderson Cathy Lynn | -- | Flying S Title And Escrow |
Source: Public Records
Mortgage History
| Date | Status | Borrower | Loan Amount |
|---|---|---|---|
| Open | Rasmussen Kami | $197,471 |
Source: Public Records
Tax History
| Year | Tax Paid | Tax Assessment Tax Assessment Total Assessment is a certain percentage of the fair market value that is determined by local assessors to be the total taxable value of land and additions on the property. | Land | Improvement |
|---|---|---|---|---|
| 2025 | $1,419 | $258,849 | $62,508 | $196,341 |
| 2024 | $1,464 | $258,849 | $62,508 | $196,341 |
| 2023 | $1,464 | $238,220 | $62,607 | $175,613 |
| 2022 | $2,329 | $227,824 | $59,601 | $168,223 |
| 2021 | $1,382 | $147,440 | $28,530 | $118,910 |
| 2020 | $1,220 | $128,106 | $25,956 | $102,150 |
| 2019 | $1,130 | $115,355 | $23,615 | $91,740 |
| 2018 | $863 | $77,328 | $21,469 | $55,859 |
| 2017 | $827 | $72,805 | $21,469 | $51,336 |
| 2016 | $1,111 | $73,125 | $10,734 | $62,391 |
| 2015 | -- | $73,125 | $21,469 | $51,656 |
| 2014 | -- | $73,124 | $21,468 | $51,656 |
Source: Public Records
Map
Nearby Homes
Your Personal Tour Guide
Ask me questions while you tour the home.