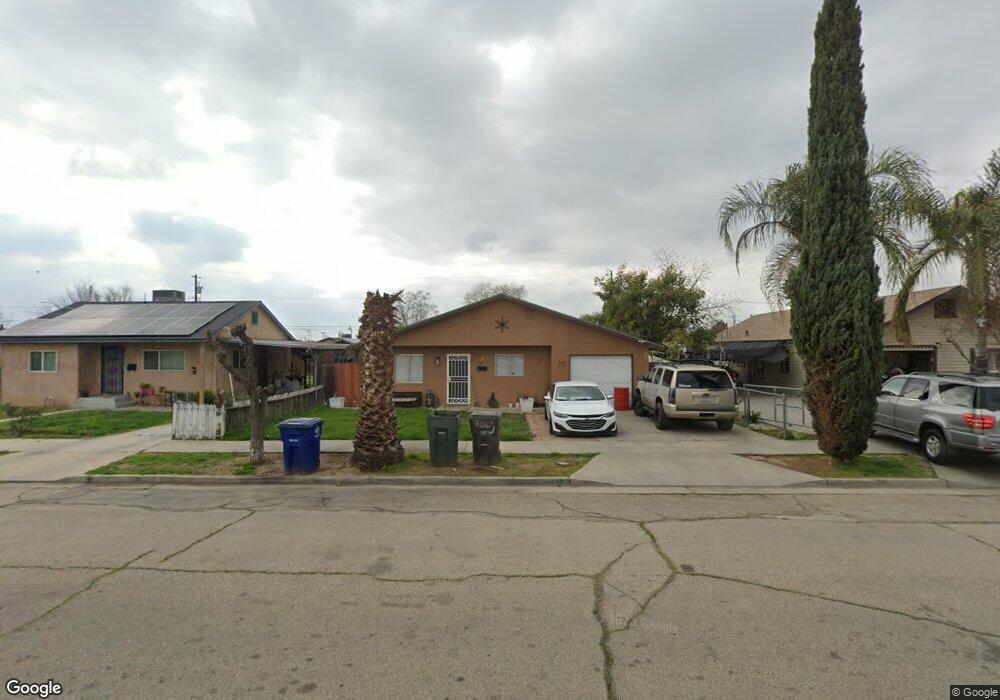
809 J St Sanger, CA 93657
Estimated Value: $185,000 - $255,000
2
Beds
1
Bath
1,008
Sq Ft
$227/Sq Ft
Est. Value
About This Home
This home is located at 809 J St, Sanger, CA 93657 and is currently estimated at $228,733, approximately $226 per square foot. 809 J St is a home located in Fresno County with nearby schools including Wilson Elementary School, Washington Academic Middle School, and Sanger High School.
Ownership History
Date
Name
Owned For
Owner Type
Purchase Details
Closed on
Aug 21, 2025
Sold by
Anguiano Adolfo
Bought by
Anguiano Adolfo and Anguiano Juana
Current Estimated Value
Purchase Details
Closed on
Apr 30, 2008
Sold by
Aviles Y Irene
Bought by
Anguiano Adolfo
Purchase Details
Closed on
Jul 5, 2006
Sold by
Anguiano Adolfo
Bought by
Anguiano Adolfo and Irene Aviles Y
Purchase Details
Closed on
Jun 7, 2005
Sold by
Perez Juana
Bought by
Anguiano Adolfo
Home Financials for this Owner
Home Financials are based on the most recent Mortgage that was taken out on this home.
Original Mortgage
$8,400
Interest Rate
5.72%
Mortgage Type
Stand Alone Second
Purchase Details
Closed on
Aug 19, 2004
Sold by
Keiser Robert Martin and Keiser Toni Shawn
Bought by
Anguiano Adolfo
Home Financials for this Owner
Home Financials are based on the most recent Mortgage that was taken out on this home.
Original Mortgage
$126,000
Interest Rate
9.2%
Mortgage Type
Balloon
Create a Home Valuation Report for This Property
The Home Valuation Report is an in-depth analysis detailing your home's value as well as a comparison with similar homes in the area
Home Values in the Area
Average Home Value in this Area
Purchase History
| Date | Buyer | Sale Price | Title Company |
|---|---|---|---|
| Anguiano Adolfo | -- | None Listed On Document | |
| Anguiano Adolfo | -- | None Available | |
| Anguiano Adolfo | -- | None Available | |
| Anguiano Adolfo | -- | Chicago Title Company | |
| Anguiano Adolfo | $140,000 | Chicago Title Company |
Source: Public Records
Mortgage History
| Date | Status | Borrower | Loan Amount |
|---|---|---|---|
| Previous Owner | Anguiano Adolfo | $8,400 | |
| Previous Owner | Anguiano Adolfo | $126,000 |
Source: Public Records
Tax History
| Year | Tax Paid | Tax Assessment Tax Assessment Total Assessment is a certain percentage of the fair market value that is determined by local assessors to be the total taxable value of land and additions on the property. | Land | Improvement |
|---|---|---|---|---|
| 2025 | $4,351 | $157,324 | $54,543 | $102,781 |
| 2023 | $4,226 | $151,217 | $52,426 | $98,791 |
| 2022 | $4,197 | $148,253 | $51,399 | $96,854 |
| 2021 | $3,637 | $101,600 | $37,400 | $64,200 |
| 2020 | $3,603 | $100,700 | $37,100 | $63,600 |
| 2019 | $3,579 | $98,800 | $36,400 | $62,400 |
| 2018 | $3,531 | $96,900 | $35,700 | $61,200 |
| 2017 | $1,080 | $95,000 | $35,000 | $60,000 |
| 2016 | $978 | $90,000 | $30,000 | $60,000 |
| 2015 | $951 | $85,700 | $36,700 | $49,000 |
| 2014 | $893 | $80,300 | $34,400 | $45,900 |
Source: Public Records
Map
Nearby Homes
Your Personal Tour Guide
Ask me questions while you tour the home.