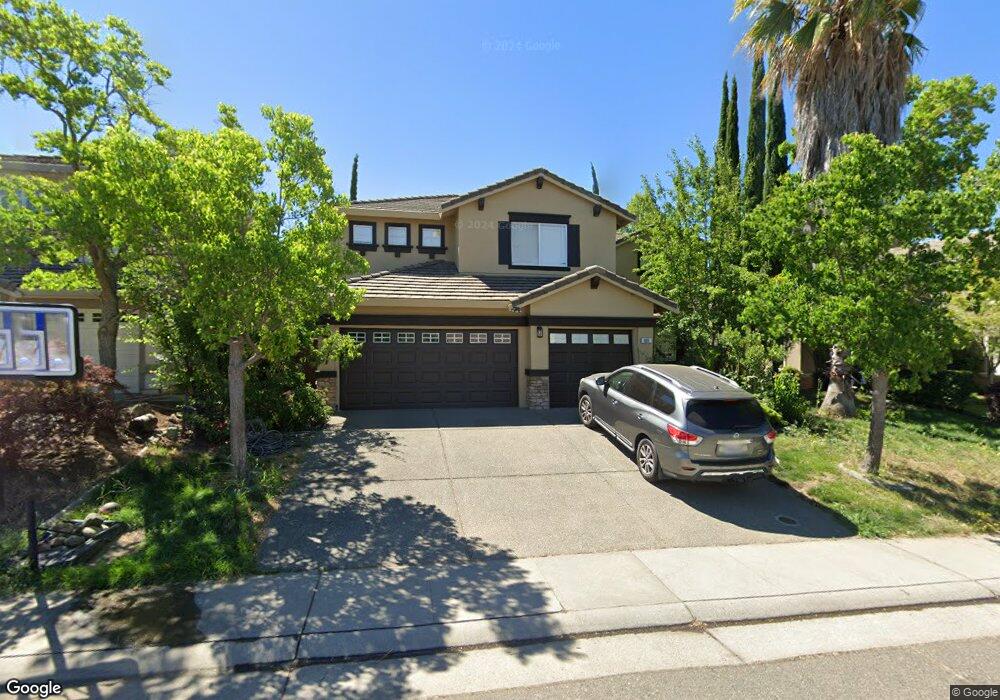
809 Morton Way Folsom, CA 95630
Prairie Oaks NeighborhoodEstimated Value: $868,000 - $1,017,000
6
Beds
3
Baths
3,100
Sq Ft
$300/Sq Ft
Est. Value
About This Home
This home is located at 809 Morton Way, Folsom, CA 95630 and is currently estimated at $929,236, approximately $299 per square foot. 809 Morton Way is a home located in Sacramento County with nearby schools including Sandra J. Gallardo Elementary School, Sutter Middle School, and Folsom High School.
Ownership History
Date
Name
Owned For
Owner Type
Purchase Details
Closed on
Nov 18, 2005
Sold by
Sibley Square Llc
Bought by
Martin Thomas
Current Estimated Value
Home Financials for this Owner
Home Financials are based on the most recent Mortgage that was taken out on this home.
Original Mortgage
$240,000
Outstanding Balance
$138,082
Interest Rate
6.87%
Mortgage Type
Fannie Mae Freddie Mac
Estimated Equity
$791,154
Purchase Details
Closed on
Jan 8, 2002
Sold by
Elkhatib Bashar Y
Bought by
Elkhatib Bashar Y and Subeh Raidah
Home Financials for this Owner
Home Financials are based on the most recent Mortgage that was taken out on this home.
Original Mortgage
$294,900
Interest Rate
6.87%
Create a Home Valuation Report for This Property
The Home Valuation Report is an in-depth analysis detailing your home's value as well as a comparison with similar homes in the area
Home Values in the Area
Average Home Value in this Area
Purchase History
| Date | Buyer | Sale Price | Title Company |
|---|---|---|---|
| Martin Thomas | $300,000 | Financial Title Company | |
| Elkhatib Bashar Y | -- | -- | |
| Elkhatib Bashar Y | -- | North American Title Co | |
| Elkhatib Bashar Y | $369,000 | North American Title Co |
Source: Public Records
Mortgage History
| Date | Status | Borrower | Loan Amount |
|---|---|---|---|
| Open | Martin Thomas | $240,000 | |
| Previous Owner | Elkhatib Bashar Y | $294,900 | |
| Closed | Elkhatib Bashar Y | $55,250 |
Source: Public Records
Tax History
| Year | Tax Paid | Tax Assessment Tax Assessment Total Assessment is a certain percentage of the fair market value that is determined by local assessors to be the total taxable value of land and additions on the property. | Land | Improvement |
|---|---|---|---|---|
| 2025 | $6,571 | $570,186 | $132,943 | $437,243 |
| 2024 | $6,571 | $559,007 | $130,337 | $428,670 |
| 2023 | $6,453 | $548,047 | $127,782 | $420,265 |
| 2022 | $6,347 | $537,302 | $125,277 | $412,025 |
| 2021 | $6,268 | $526,768 | $122,821 | $403,947 |
| 2020 | $5,882 | $521,368 | $121,562 | $399,806 |
| 2019 | $5,786 | $511,146 | $119,179 | $391,967 |
| 2018 | $5,647 | $501,125 | $116,843 | $384,282 |
| 2017 | $7,127 | $491,300 | $114,552 | $376,748 |
| 2016 | $7,367 | $481,667 | $112,306 | $369,361 |
| 2015 | $7,117 | $474,433 | $110,620 | $363,813 |
| 2014 | $6,823 | $465,141 | $108,454 | $356,687 |
Source: Public Records
Map
Nearby Homes
- 968 Carter St
- 631 Rogers Cir
- 157 Sutcliffe Cir
- 632 Fisher Cir
- 104 Hesser Ct
- 919 Sterling Cir
- 894 Blossom Rock Ln
- 931 Willow Bridge Dr
- 683 Loomis Cir
- 2702 Ferry Cir Unit 102
- 145 Hopfield Dr
- 102 Black Gold Ln
- 0 Figueroa St Unit 225034113
- 301 Blossom Rock Ln Unit 53
- 692 Humbert St
- 1054 Ledgestone Dr
- 701 Ferrier Way
- 120 Elkins Cir
- 114 Barnhill Dr
- 382 Seaton Dr
Your Personal Tour Guide
Ask me questions while you tour the home.