
Seller's Agent in 2023
Mhisho Vuong-Lynch
Cornerstone Partners QC - Real Broker, LLC
(563) 370-1735
3 in this area
49 Total Sales


Estimated Value: $82,000 - $120,867
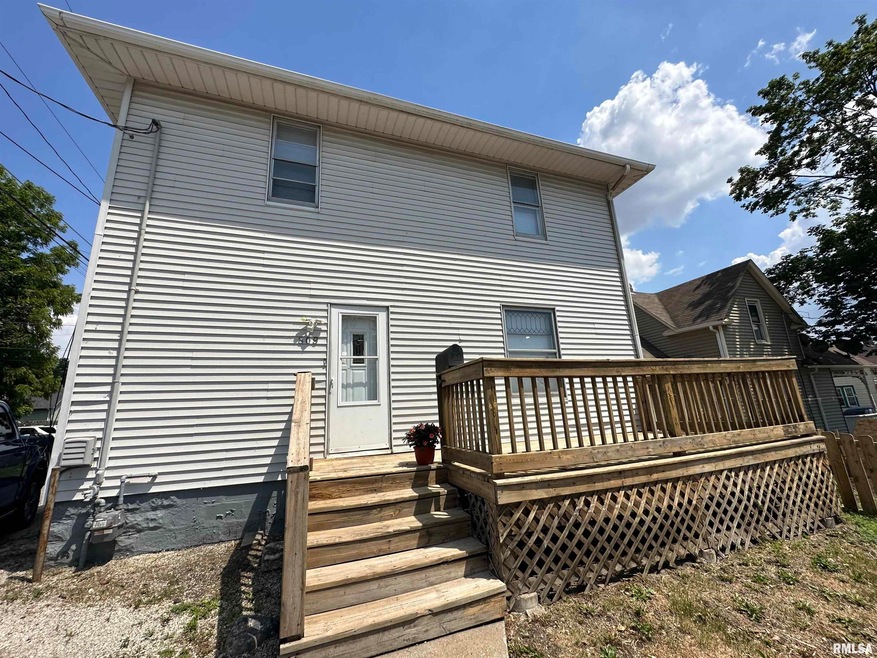
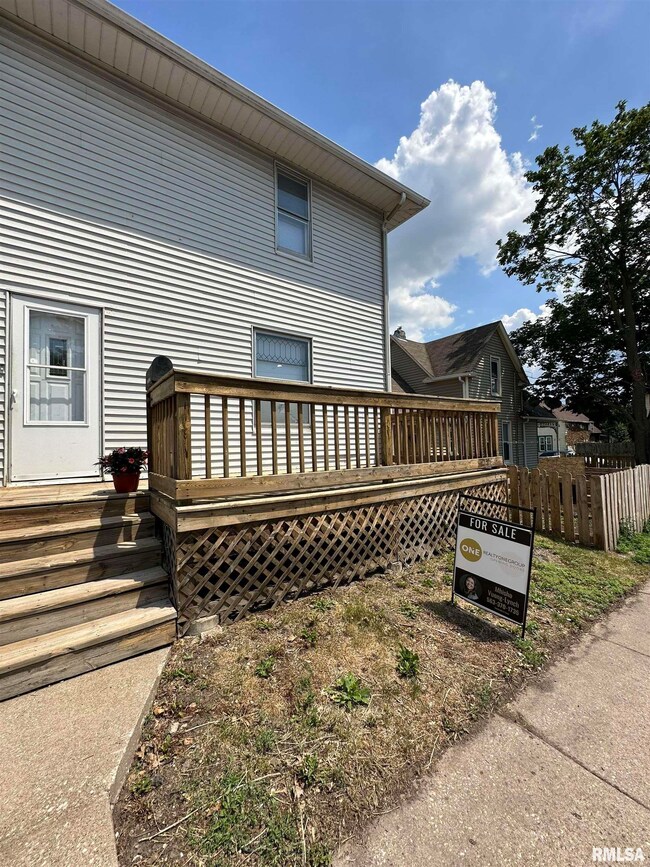
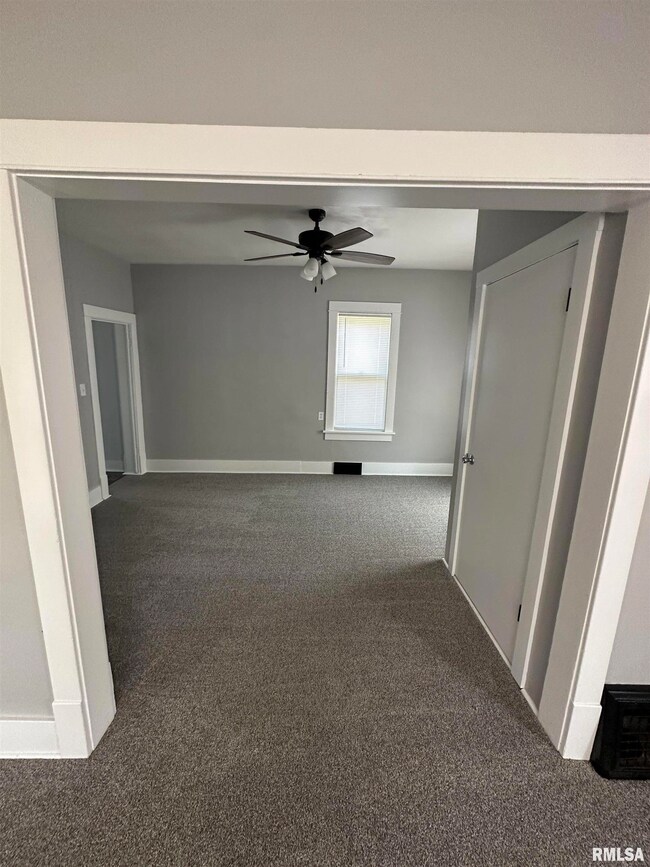
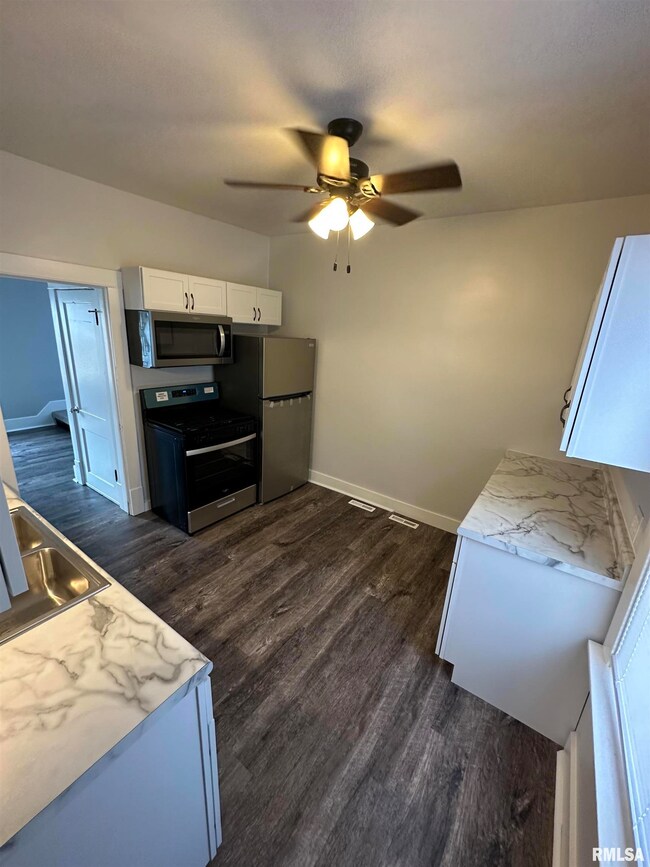
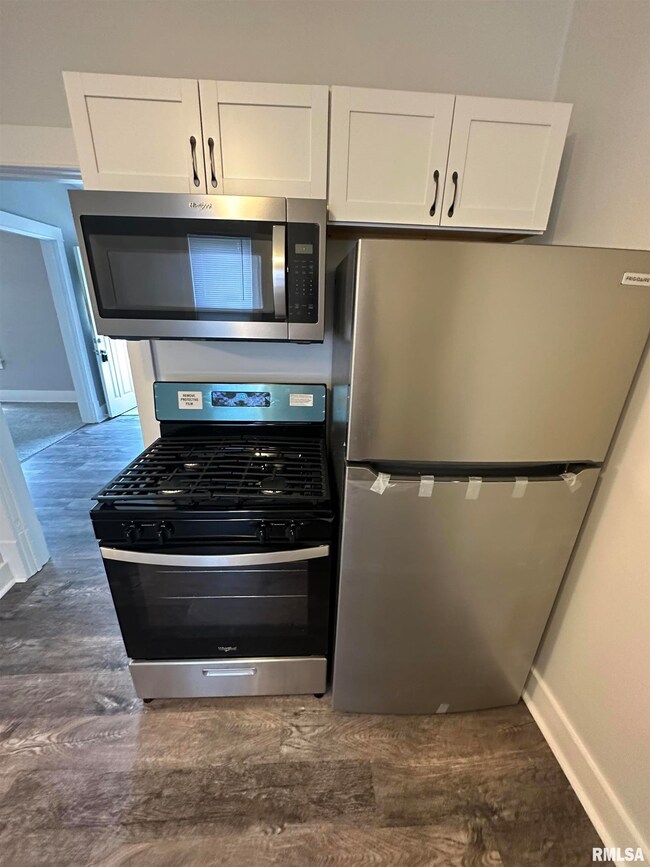
Fully remodeled single family home just minutes from downtown Davenport. Walking distance to Putnam and Fejervary Park. Formal dining room, spacious foyer and large upstairs bathroom. Spacious bedrooms and beautiful front deck, perfect for grilling and small gatherings. Don't miss out on this gem!
Last Agent to Sell the Property
Cornerstone Partners QC - Real Broker, LLC License #S67851000 Listed on: 06/02/2023
| Date | Buyer | Sale Price | Title Company |
|---|---|---|---|
| Mitchell Martell R | $106,000 | None Listed On Document | |
| Young Karen C | $75,000 | None Listed On Document | |
| Harris Family Rental Homes Llc | $31,000 | None Available |
| Date | Status | Borrower | Loan Amount |
|---|---|---|---|
| Open | Mitchell Martell R | $104,080 |
| Date | Event | Price | List to Sale | Price per Sq Ft |
|---|---|---|---|---|
| 07/21/2023 07/21/23 | Sold | $106,000 | +7.1% | $79 / Sq Ft |
| 06/03/2023 06/03/23 | Pending | -- | -- | -- |
| 06/02/2023 06/02/23 | For Sale | $99,000 | -- | $74 / Sq Ft |
| Year | Tax Paid | Tax Assessment Tax Assessment Total Assessment is a certain percentage of the fair market value that is determined by local assessors to be the total taxable value of land and additions on the property. | Land | Improvement |
|---|---|---|---|---|
| 2025 | $1,402 | $93,630 | $4,400 | $89,230 |
| 2024 | $1,096 | $78,500 | $4,400 | $74,100 |
| 2023 | $1,054 | $62,890 | $4,400 | $58,490 |
| 2022 | $1,209 | $49,360 | $4,400 | $44,960 |
| 2021 | $1,060 | $49,360 | $4,400 | $44,960 |
| 2020 | $960 | $44,210 | $4,400 | $39,810 |
| 2019 | $992 | $44,210 | $4,400 | $39,810 |
| 2018 | $515 | $44,210 | $4,400 | $39,810 |
| 2017 | $246 | $44,210 | $4,400 | $39,810 |
| 2016 | $968 | $44,210 | $0 | $0 |
| 2015 | $968 | $47,450 | $0 | $0 |
| 2014 | $860 | $47,450 | $0 | $0 |
| 2013 | $842 | $0 | $0 | $0 |
| 2012 | -- | $47,410 | $2,850 | $44,560 |
Seller's Agent in 2023
Mhisho Vuong-Lynch
Cornerstone Partners QC - Real Broker, LLC
(563) 370-1735
3 in this area
49 Total Sales
Buyer's Agent in 2023
Adam Bellendier
Navigate LPT Realty
(563) 340-6179
1 in this area
58 Total Sales
Source: RMLS Alliance
MLS Number: QC4243324
APN: H0044-29
Disclaimer: Certain information contained herein is derived from information provided by parties other than Homes.com. All information provided is deemed reliable, but is not guaranteed to be accurate and should be independently verified.
![]() IDX information is provided exclusively for personal, non-commercial use, and may not be used for any purpose other than to identify prospective properties consumers may be interested in purchasing. Information is deemed reliable but not guaranteed.
IDX information is provided exclusively for personal, non-commercial use, and may not be used for any purpose other than to identify prospective properties consumers may be interested in purchasing. Information is deemed reliable but not guaranteed.