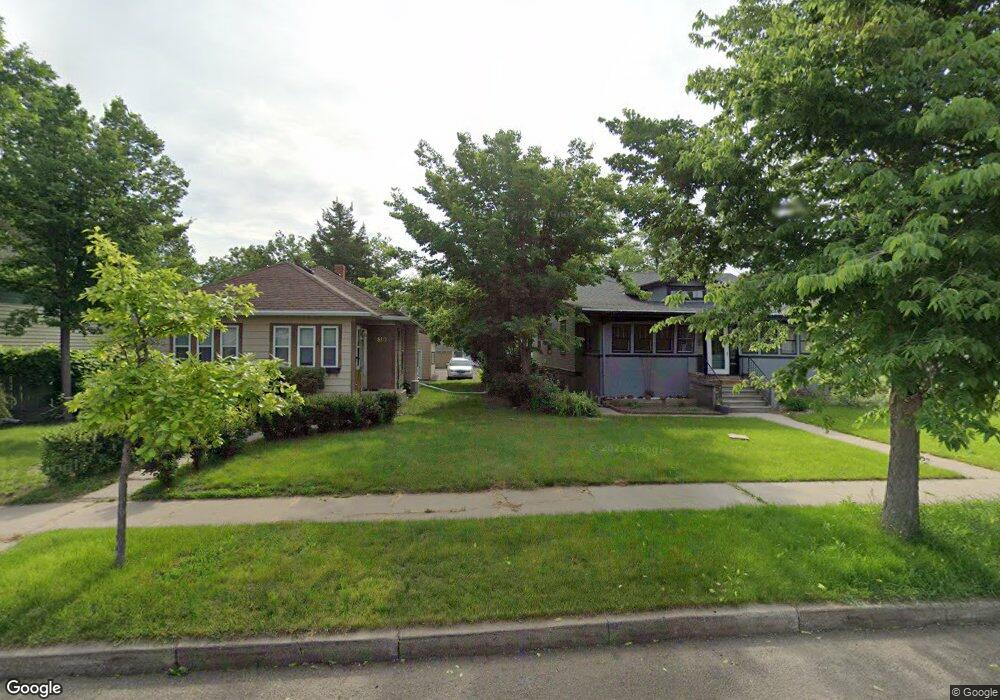
809 N Main St Aberdeen, SD 57401
Estimated Value: $198,072 - $314,000
4
Beds
2
Baths
2,450
Sq Ft
$93/Sq Ft
Est. Value
About This Home
This home is located at 809 N Main St, Aberdeen, SD 57401 and is currently estimated at $227,518, approximately $92 per square foot. 809 N Main St is a home located in Brown County with nearby schools including C.C. Lee Elementary School, Holgate Middle School, and Central High School.
Ownership History
Date
Name
Owned For
Owner Type
Purchase Details
Closed on
Mar 28, 2008
Sold by
Pelton Charles L and Pelton Monica K
Bought by
Duncan Raphael C and Duncan Heather A
Current Estimated Value
Home Financials for this Owner
Home Financials are based on the most recent Mortgage that was taken out on this home.
Original Mortgage
$92,400
Outstanding Balance
$57,718
Interest Rate
5.79%
Mortgage Type
New Conventional
Estimated Equity
$169,800
Create a Home Valuation Report for This Property
The Home Valuation Report is an in-depth analysis detailing your home's value as well as a comparison with similar homes in the area
Home Values in the Area
Average Home Value in this Area
Purchase History
| Date | Buyer | Sale Price | Title Company |
|---|---|---|---|
| Duncan Raphael C | $99,000 | None Available |
Source: Public Records
Mortgage History
| Date | Status | Borrower | Loan Amount |
|---|---|---|---|
| Open | Duncan Raphael C | $92,400 |
Source: Public Records
Tax History
| Year | Tax Paid | Tax Assessment Tax Assessment Total Assessment is a certain percentage of the fair market value that is determined by local assessors to be the total taxable value of land and additions on the property. | Land | Improvement |
|---|---|---|---|---|
| 2025 | $2,599 | $167,150 | $13,505 | $153,645 |
| 2024 | $2,697 | $163,493 | $13,505 | $149,988 |
| 2023 | $2,542 | $160,861 | $13,505 | $147,356 |
| 2022 | $2,421 | $145,834 | $12,950 | $132,884 |
| 2021 | $2,334 | $135,308 | $12,950 | $122,358 |
| 2020 | $2,304 | $129,150 | $12,950 | $116,200 |
| 2019 | $2,335 | $129,150 | $12,950 | $116,200 |
| 2018 | $2,241 | $129,150 | $12,950 | $116,200 |
| 2017 | -- | $129,150 | $12,950 | $116,200 |
| 2016 | -- | $129,150 | $0 | $129,150 |
| 2015 | -- | $122,800 | $0 | $122,800 |
| 2014 | -- | $119,610 | $0 | $119,610 |
| 2011 | -- | $109,905 | $0 | $0 |
Source: Public Records
Map
Nearby Homes
- 601 N 1st St
- 305 N 3rd St
- 822 N Washington St
- 518 N 1st St
- 1216 N Lincoln St
- 512 N 3rd St
- 508 N 3rd St
- 1301 N 2nd St
- 1303 N Lincoln St
- 315 N Washington St
- 1321 N Washington St
- 1314 N 3rd St
- 610 N Arch St
- 1534 Hannah Ln
- 1109 Lloyd St N
- 1309 N State St
- 6 Lilac Ln
- 413 15th Ave NE
- 902 N Penn St
- 1102 N Penn St
Your Personal Tour Guide
Ask me questions while you tour the home.