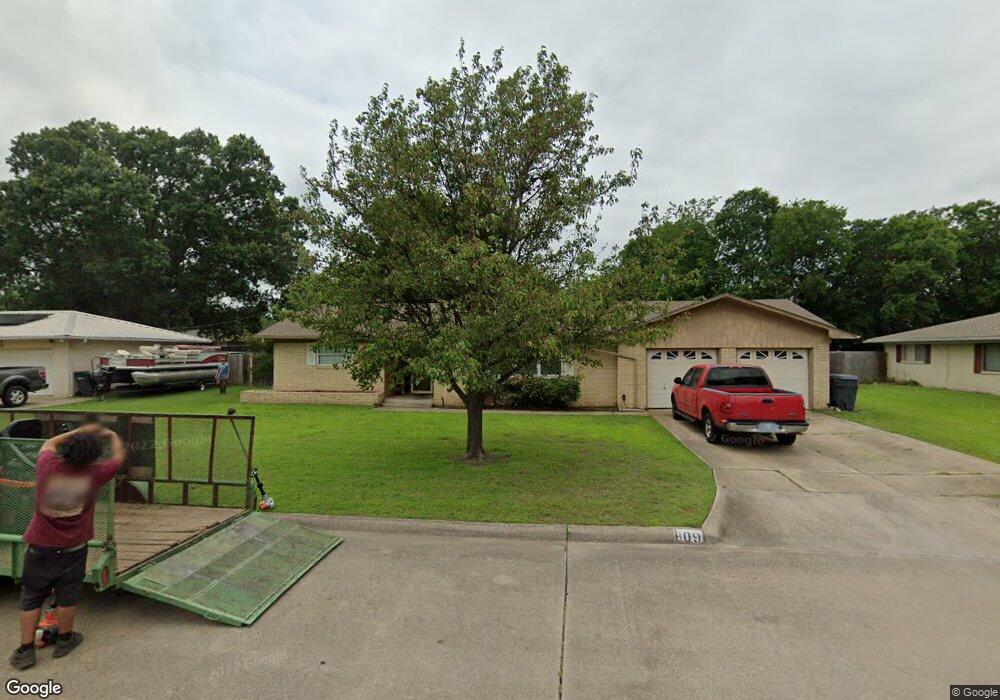
809 Pershing Dr W Ardmore, OK 73401
Estimated Value: $178,994 - $245,000
3
Beds
2
Baths
1,639
Sq Ft
$128/Sq Ft
Est. Value
About This Home
This home is located at 809 Pershing Dr W, Ardmore, OK 73401 and is currently estimated at $210,249, approximately $128 per square foot. 809 Pershing Dr W is a home located in Carter County with nearby schools including Lincoln Elementary School, Ardmore Middle School, and Ardmore High School.
Ownership History
Date
Name
Owned For
Owner Type
Purchase Details
Closed on
Mar 24, 2023
Sold by
Taylor Rodney and Taylor Keri
Bought by
Brown Larry and Brown Danielle
Current Estimated Value
Purchase Details
Closed on
Nov 5, 2014
Sold by
Nixon Roger
Bought by
Taylor Rodney and Taylor Jettie
Purchase Details
Closed on
Jul 22, 2005
Sold by
Turner Wayne
Bought by
Nixon Roger
Home Financials for this Owner
Home Financials are based on the most recent Mortgage that was taken out on this home.
Original Mortgage
$94,000
Interest Rate
5.55%
Mortgage Type
New Conventional
Purchase Details
Closed on
May 17, 2001
Sold by
Evans Ot Levy Betty
Bought by
Turner Wayne
Purchase Details
Closed on
Jul 28, 2000
Sold by
Evans Ot
Bought by
Evens Ot An Levy Betty
Create a Home Valuation Report for This Property
The Home Valuation Report is an in-depth analysis detailing your home's value as well as a comparison with similar homes in the area
Purchase History
| Date | Buyer | Sale Price | Title Company |
|---|---|---|---|
| Brown Larry | $143,000 | -- | |
| Taylor Rodney | $129,000 | -- | |
| Nixon Roger | $117,500 | -- | |
| Turner Wayne | $65,000 | -- | |
| Evens Ot An Levy Betty | -- | -- |
Source: Public Records
Mortgage History
| Date | Status | Borrower | Loan Amount |
|---|---|---|---|
| Previous Owner | Nixon Roger | $94,000 |
Source: Public Records
Tax History
| Year | Tax Paid | Tax Assessment Tax Assessment Total Assessment is a certain percentage of the fair market value that is determined by local assessors to be the total taxable value of land and additions on the property. | Land | Improvement |
|---|---|---|---|---|
| 2025 | $2,070 | $20,743 | $2,400 | $18,343 |
| 2024 | $2,071 | $22,989 | $2,400 | $20,589 |
| 2023 | $2,295 | $17,471 | $2,137 | $15,334 |
| 2022 | $1,591 | $16,640 | $2,103 | $14,537 |
| 2021 | $1,599 | $15,847 | $2,045 | $13,802 |
| 2020 | $1,501 | $15,093 | $1,920 | $13,173 |
| 2019 | $1,495 | $15,402 | $1,920 | $13,482 |
| 2018 | $1,484 | $15,030 | $1,548 | $13,482 |
| 2017 | $1,402 | $15,339 | $1,548 | $13,791 |
| 2016 | $1,397 | $14,985 | $1,548 | $13,437 |
| 2015 | $1,189 | $15,480 | $1,548 | $13,932 |
| 2014 | $1,291 | $14,425 | $1,445 | $12,980 |
Source: Public Records
Map
Nearby Homes
- 725 Marlena Ln
- 718 Marlena Ln
- 811 Rosewood St
- 535 Sunset Dr SW
- 2205 Torrey Pines
- 2200 Cloverleaf Place
- 1700 6th Ave SW
- 531 Sunset Dr SW
- 1616 6th Ave SW
- 1834 Sunset Park Terrace
- 2222 Cloverleaf Place
- 930 P St SW Unit 3
- 1111 Surrey Dr
- 1001 Rockford Ct
- 1804 Stanley St SW
- 305 P St SW
- 415 Sunset Dr SW
- 1006 S Rockford Rd
- 711 N St SW
- 2604 Ridgeway St
- 815 Pershing Dr E
- 805 Pershing Dr E
- 816 Pershing Dr W
- 819 Pershing Dr E
- 820 Pershing Dr W
- 812 Pershing Dr W
- 806 Pershing Dr E
- 801 Pershing Dr E
- 828 Pershing Dr W
- 800 Pershing Dr W
- 802 Pershing Dr E
- 818 Pershing Dr E
- 832 Pershing Dr E
- 826 Pershing Dr E
- 809 Pershing Dr E
- 817 Pershing Dr W
- 821 Pershing Dr W
- 833 Pershing Dr W
- 1929 Lawrence Rd
Your Personal Tour Guide
Ask me questions while you tour the home.