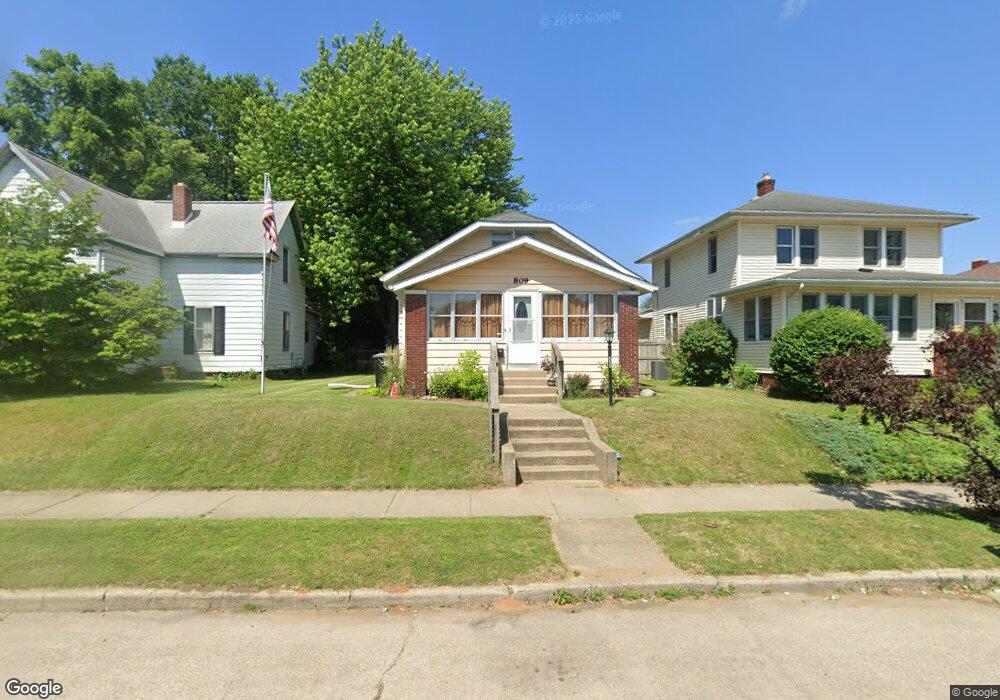
809 S 25th St South Bend, IN 46615
River Park NeighborhoodEstimated Value: $114,000 - $153,000
3
Beds
1
Bath
1,116
Sq Ft
$123/Sq Ft
Est. Value
About This Home
This home is located at 809 S 25th St, South Bend, IN 46615 and is currently estimated at $137,310, approximately $123 per square foot. 809 S 25th St is a home located in St. Joseph County with nearby schools including Cora B. Darling Elementary School, Nuner Fine Arts Academy, and Clay Intermediate Center.
Ownership History
Date
Name
Owned For
Owner Type
Purchase Details
Closed on
Sep 16, 2010
Sold by
Fannie Mae
Bought by
Berndt Katherine A
Current Estimated Value
Purchase Details
Closed on
Jul 21, 2010
Sold by
The Huntington National Bank
Bought by
Federal National Mortgage Association
Purchase Details
Closed on
Jun 24, 2010
Sold by
Morris Kirk D and Morris Kirk O
Bought by
The Huntington National Bank
Purchase Details
Closed on
Jan 25, 2006
Sold by
Reichow Paul L and Reichow Yvonne J
Bought by
Morris Kirk D
Home Financials for this Owner
Home Financials are based on the most recent Mortgage that was taken out on this home.
Original Mortgage
$69,000
Interest Rate
6.46%
Mortgage Type
New Conventional
Create a Home Valuation Report for This Property
The Home Valuation Report is an in-depth analysis detailing your home's value as well as a comparison with similar homes in the area
Home Values in the Area
Average Home Value in this Area
Purchase History
| Date | Buyer | Sale Price | Title Company |
|---|---|---|---|
| Berndt Katherine A | -- | Meridian Title Corp | |
| Federal National Mortgage Association | -- | None Available | |
| The Huntington National Bank | $74,389 | None Available | |
| Morris Kirk D | -- | Land America Lawyers Title |
Source: Public Records
Mortgage History
| Date | Status | Borrower | Loan Amount |
|---|---|---|---|
| Previous Owner | Morris Kirk D | $69,000 |
Source: Public Records
Tax History Compared to Growth
Tax History
| Year | Tax Paid | Tax Assessment Tax Assessment Total Assessment is a certain percentage of the fair market value that is determined by local assessors to be the total taxable value of land and additions on the property. | Land | Improvement |
|---|---|---|---|---|
| 2024 | $1,342 | $119,000 | $6,100 | $112,900 |
| 2023 | $697 | $107,700 | $6,100 | $101,600 |
| 2022 | $697 | $89,600 | $6,100 | $83,500 |
| 2021 | $939 | $80,400 | $3,900 | $76,500 |
| 2020 | $804 | $68,900 | $3,400 | $65,500 |
| 2019 | $655 | $61,200 | $2,700 | $58,500 |
| 2018 | $620 | $52,400 | $2,300 | $50,100 |
| 2017 | $624 | $51,800 | $2,300 | $49,500 |
| 2016 | $632 | $51,800 | $2,300 | $49,500 |
| 2014 | $585 | $50,900 | $2,300 | $48,600 |
Source: Public Records
Map
Nearby Homes
- 815 S 26th St
- 806 S 26th St
- 634 S 26th St
- 537 S 27th St
- 513 S 26th St
- 1017 S 23rd St
- 525 S 28th St
- 510 S Ironwood Dr
- 1111 S 27th St
- 2001 E Jefferson Blvd
- 734 S 33rd St
- 137 Monmoor Ave
- 3312 Mishawaka Ave
- 1603 Hoover Ave
- 930 S 34th St
- 3312 E Jefferson Square
- 715 S 35th St
- 1105 S 35th St
- 1229 S 34th St
- 741 S 36th St