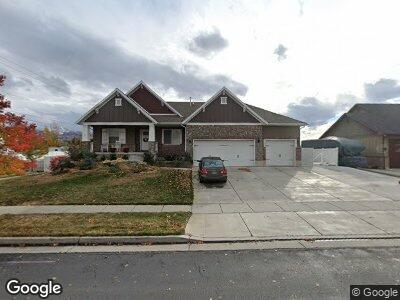
809 W 1320 N West Bountiful, UT 84087
Estimated Value: $709,000 - $875,000
5
Beds
4
Baths
3,666
Sq Ft
$219/Sq Ft
Est. Value
About This Home
This home is located at 809 W 1320 N, West Bountiful, UT 84087 and is currently estimated at $802,654, approximately $218 per square foot. 809 W 1320 N is a home located in Davis County with nearby schools including West Bountiful Elementary School, Bountiful Junior High School, and Viewmont High School.
Ownership History
Date
Name
Owned For
Owner Type
Purchase Details
Closed on
Feb 25, 2015
Sold by
H D Pirela Lc
Bought by
Garcia Johny David and Astorga Rocio Cecilia
Current Estimated Value
Home Financials for this Owner
Home Financials are based on the most recent Mortgage that was taken out on this home.
Original Mortgage
$413,250
Interest Rate
3.6%
Mortgage Type
New Conventional
Purchase Details
Closed on
Nov 5, 2013
Sold by
Triple S Development Inc
Bought by
H D Pirela Lc
Create a Home Valuation Report for This Property
The Home Valuation Report is an in-depth analysis detailing your home's value as well as a comparison with similar homes in the area
Home Values in the Area
Average Home Value in this Area
Purchase History
| Date | Buyer | Sale Price | Title Company |
|---|---|---|---|
| Garcia Johny David | -- | Aspen Title Insura | |
| H D Pirela Lc | -- | Aspen Title Insurance |
Source: Public Records
Mortgage History
| Date | Status | Borrower | Loan Amount |
|---|---|---|---|
| Open | Garcia Johny David | $414,375 | |
| Closed | Garcia Johny D | $28,600 | |
| Closed | Garcia Johny David | $413,250 | |
| Previous Owner | Triple S Development Inc | $575,000 |
Source: Public Records
Tax History Compared to Growth
Tax History
| Year | Tax Paid | Tax Assessment Tax Assessment Total Assessment is a certain percentage of the fair market value that is determined by local assessors to be the total taxable value of land and additions on the property. | Land | Improvement |
|---|---|---|---|---|
| 2024 | $4,557 | $407,000 | $109,089 | $297,911 |
| 2023 | $4,423 | $722,000 | $206,433 | $515,567 |
| 2022 | $4,419 | $403,150 | $98,966 | $304,184 |
| 2021 | $4,369 | $614,000 | $133,412 | $480,588 |
| 2020 | $3,938 | $547,000 | $123,861 | $423,139 |
| 2019 | $3,911 | $537,000 | $125,032 | $411,968 |
| 2018 | $3,970 | $539,000 | $125,302 | $413,698 |
| 2016 | $3,406 | $248,820 | $32,755 | $216,065 |
| 2015 | $3,468 | $239,855 | $32,755 | $207,100 |
| 2014 | $953 | $59,555 | $59,555 | $0 |
| 2013 | -- | $77,199 | $77,199 | $0 |
Source: Public Records
Map
Nearby Homes