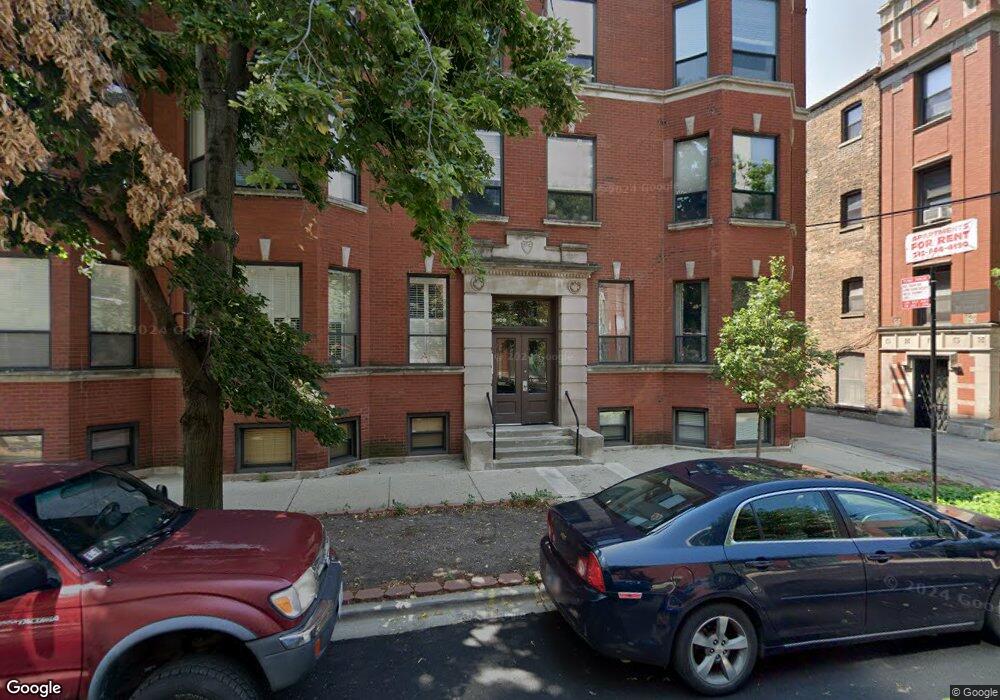
809 W Bradley Place Unit 3 Chicago, IL 60613
Lakeview East NeighborhoodEstimated Value: $398,000 - $526,000
--
Bed
--
Bath
--
Sq Ft
10,803
Sq Ft Lot
About This Home
This home is located at 809 W Bradley Place Unit 3, Chicago, IL 60613 and is currently estimated at $460,476. 809 W Bradley Place Unit 3 is a home located in Cook County with nearby schools including Greeley Elementary School, Lake View High School, and Bernard Zell Anshe Emet Day School.
Ownership History
Date
Name
Owned For
Owner Type
Purchase Details
Closed on
Feb 10, 2017
Sold by
Anehall Kim J and Morris Nicole
Bought by
Anehall Kim J and Anehall Kim J
Current Estimated Value
Purchase Details
Closed on
Jun 18, 2010
Sold by
Nichol Thomas and Nichol Katie Ann
Bought by
Anehall Kim and Morris Nicole
Home Financials for this Owner
Home Financials are based on the most recent Mortgage that was taken out on this home.
Original Mortgage
$340,415
Interest Rate
5.5%
Mortgage Type
FHA
Purchase Details
Closed on
Mar 17, 2009
Sold by
Torcasi David and Torcasi Lindsay E
Bought by
Albert Devon
Purchase Details
Closed on
Mar 16, 2007
Sold by
801 & 11 West Bradley Llc
Bought by
Nichol Thomas
Home Financials for this Owner
Home Financials are based on the most recent Mortgage that was taken out on this home.
Original Mortgage
$52,500
Interest Rate
6.31%
Mortgage Type
Stand Alone Second
Create a Home Valuation Report for This Property
The Home Valuation Report is an in-depth analysis detailing your home's value as well as a comparison with similar homes in the area
Home Values in the Area
Average Home Value in this Area
Purchase History
| Date | Buyer | Sale Price | Title Company |
|---|---|---|---|
| Anehall Kim J | $45,500 | Attorney | |
| Anehall Kim | $345,000 | Cti | |
| Albert Devon | $222,000 | Fat | |
| Nichol Thomas | $350,000 | None Available |
Source: Public Records
Mortgage History
| Date | Status | Borrower | Loan Amount |
|---|---|---|---|
| Previous Owner | Anehall Kim | $340,415 | |
| Previous Owner | Nichol Thomas | $52,500 | |
| Previous Owner | Nichol Thomas | $280,000 |
Source: Public Records
Tax History Compared to Growth
Tax History
| Year | Tax Paid | Tax Assessment Tax Assessment Total Assessment is a certain percentage of the fair market value that is determined by local assessors to be the total taxable value of land and additions on the property. | Land | Improvement |
|---|---|---|---|---|
| 2024 | $7,038 | $37,185 | $10,509 | $26,676 |
| 2023 | $6,865 | $31,000 | $8,475 | $22,525 |
| 2022 | $6,865 | $31,000 | $8,475 | $22,525 |
| 2021 | $6,736 | $30,998 | $8,474 | $22,524 |
| 2020 | $6,913 | $28,785 | $3,615 | $25,170 |
| 2019 | $6,781 | $31,358 | $3,615 | $27,743 |
| 2018 | $6,674 | $31,358 | $3,615 | $27,743 |
| 2017 | $5,894 | $28,911 | $3,163 | $25,748 |
| 2016 | $5,661 | $28,911 | $3,163 | $25,748 |
| 2015 | $5,166 | $28,911 | $3,163 | $25,748 |
| 2014 | $5,609 | $30,585 | $2,598 | $27,987 |
| 2013 | $5,492 | $30,585 | $2,598 | $27,987 |
Source: Public Records
Map
Nearby Homes
- 852 W Grace St Unit T
- 3732 N Pine Grove Ave Unit 2A
- 3758 N Fremont St Unit 2
- 3758 N Fremont St Unit 1
- 3723 N Wilton Ave Unit 4
- 3635 N Wilton Ave Unit 4
- 3638 N Pine Grove Ave Unit G2
- 3620 N Pine Grove Ave Unit 504
- 611 W Patterson Ave Unit 317
- 3810 N Fremont St Unit 2B
- 636 W Waveland Ave Unit 1A
- 3750 N Wilton Ave Unit 5
- 3660 N Lake Shore Dr Unit P-47
- 3660 N Lake Shore Dr Unit P048
- 3660 N Lake Shore Dr Unit 3301
- 3660 N Lake Shore Dr Unit 1015
- 3660 N Lake Shore Dr Unit 1407
- 630 W Waveland Ave Unit 2A
- 3826 N Fremont St Unit 1N
- 625 W Addison St Unit 3
- 809 W Bradley Place Unit 2
- 809 W Bradley Place Unit 1
- 809 W Bradley Place Unit G
- 809 W Bradley Place
- 809 W Bradley Place
- 809 W Bradley Place Unit 1
- 809 W Bradley Place Unit 2
- 809 W Bradley Place Unit G
- 809 W Bradley Place Unit 3
- 807 W Bradley Place Unit 3
- 807 W Bradley Place Unit 1
- 807 W Bradley Place Unit G
- 807 W Bradley Place
- 807 W Bradley Place Unit 2
- 807 W Bradley Place Unit 2
- 807 W Bradley Place Unit 3
- 807 W Bradley Place Unit 1
- 811 W Bradley Place Unit 3
- 811 W Bradley Place Unit 2
- 811 W Bradley Place Unit 1