Estimated Value: $655,000 - $738,000
3
Beds
3
Baths
1,835
Sq Ft
$378/Sq Ft
Est. Value
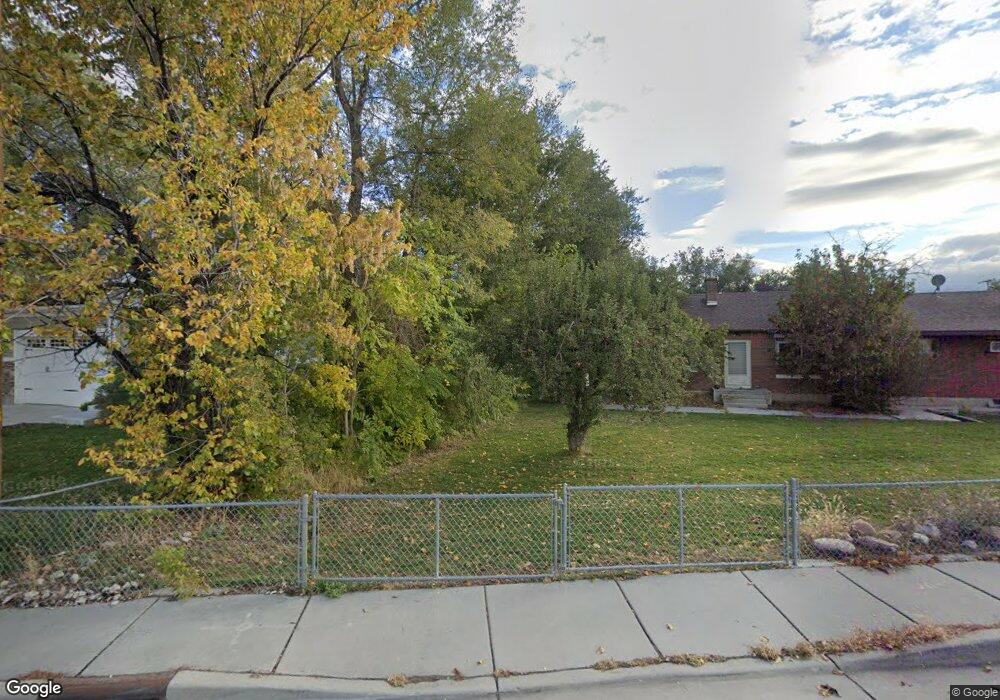
About This Home
This home is located at 8091 S 100 E, Sandy, UT 84070 and is currently estimated at $692,874, approximately $377 per square foot. 8091 S 100 E is a home located in Salt Lake County with nearby schools including Midvalley Elementary School, Union Middle School, and Hillcrest High School.
Ownership History
Date
Name
Owned For
Owner Type
Purchase Details
Closed on
May 4, 2023
Sold by
Ashby Family Trust
Bought by
Fuelling Daniel and Siebels Beth
Current Estimated Value
Home Financials for this Owner
Home Financials are based on the most recent Mortgage that was taken out on this home.
Original Mortgage
$532,500
Outstanding Balance
$515,485
Interest Rate
6.42%
Mortgage Type
New Conventional
Estimated Equity
$177,389
Purchase Details
Closed on
May 3, 2023
Sold by
Ashby Family Trust
Bought by
Fuelling Daniel and Siebels Beth
Home Financials for this Owner
Home Financials are based on the most recent Mortgage that was taken out on this home.
Original Mortgage
$532,500
Outstanding Balance
$515,485
Interest Rate
6.42%
Mortgage Type
New Conventional
Estimated Equity
$177,389
Purchase Details
Closed on
Apr 22, 2013
Sold by
Ashby Christopher J and Ashby Kalli O
Bought by
Ashby Christopher J and Ashby Kalli
Purchase Details
Closed on
Dec 14, 1999
Sold by
Pearson Clare and Pearson Dorene
Bought by
Ashby Christopher J and Ashby Kalli O
Home Financials for this Owner
Home Financials are based on the most recent Mortgage that was taken out on this home.
Original Mortgage
$195,000
Interest Rate
7.69%
Create a Home Valuation Report for This Property
The Home Valuation Report is an in-depth analysis detailing your home's value as well as a comparison with similar homes in the area
Home Values in the Area
Average Home Value in this Area
Purchase History
| Date | Buyer | Sale Price | Title Company |
|---|---|---|---|
| Fuelling Daniel | -- | Masters Title | |
| Fuelling Daniel | -- | Masters Title | |
| Ashby Christopher J | -- | None Available | |
| Ashby Christopher J | -- | Equity Title |
Source: Public Records
Mortgage History
| Date | Status | Borrower | Loan Amount |
|---|---|---|---|
| Open | Fuelling Daniel | $532,500 | |
| Closed | Fuelling Daniel | $532,500 | |
| Previous Owner | Ashby Christopher J | $195,000 |
Source: Public Records
Tax History
| Year | Tax Paid | Tax Assessment Tax Assessment Total Assessment is a certain percentage of the fair market value that is determined by local assessors to be the total taxable value of land and additions on the property. | Land | Improvement |
|---|---|---|---|---|
| 2025 | $3,661 | $593,300 | $240,300 | $353,000 |
| 2024 | $3,661 | $601,000 | $224,700 | $376,300 |
| 2023 | $1,610 | $483,800 | $213,600 | $270,200 |
| 2022 | $233 | $489,000 | $209,400 | $279,600 |
| 2021 | $76 | $387,000 | $179,000 | $208,000 |
| 2020 | $2,776 | $356,900 | $170,100 | $186,800 |
| 2019 | $2,656 | $332,700 | $160,400 | $172,300 |
| 2018 | $0 | $299,700 | $160,400 | $139,300 |
| 2017 | $2,336 | $284,400 | $160,400 | $124,000 |
| 2016 | $2,336 | $275,800 | $160,400 | $115,400 |
| 2015 | $2,994 | $347,500 | $162,000 | $185,500 |
| 2014 | $2,786 | $315,800 | $149,200 | $166,600 |
Source: Public Records
Map
Nearby Homes
- 135 E Station St
- 190 E White Spruce Cove Unit 805
- 116 E Resaca Dr Unit F2
- 257 E Water Mill Way
- 257 Water Mill Way Unit 211
- 8229 S Resaca Dr Unit D3
- 90 E Resaca Dr Unit C11
- 274 E Water Mill Way Unit 230
- 8264 S Resaca Dr Unit K9
- 117 E Calbourne Ln Unit I4
- 74 E Resaca Dr Unit B12
- 8278 S Resaca Dr Unit L1
- 144 E Chambord Ct
- 140 E Chambord Ct
- 138 E Chambord Ct
- 136 E Chambord Ct
- 132 E Chambord Ct
- 36 E Opequon Rd
- 36 Marquette Dr
- 393 E Corral Creek Dr
- 8091 S 150 E
- 8089 S 100 E
- 8111 S 100 E
- 8111 S 100 E
- 8125 S 100 E
- 8125 S 100 E
- 153 E Station Landing Way
- 149 Station Landing Way
- 149 Station Landing Way Unit 30
- 145 Station Landing Way Unit 31
- 153 Station Landing Way
- 141 E Station Landing Way
- 141 Station Landing Way
- 141 Station Landing Way Unit 32
- 137 Station Landing Way
- 157 E Station Landing Way
- 157 Station Landing Way
- 173 E 8135 S
- 183 E 8135 S
- 133 Station Landing Way
Your Personal Tour Guide
Ask me questions while you tour the home.