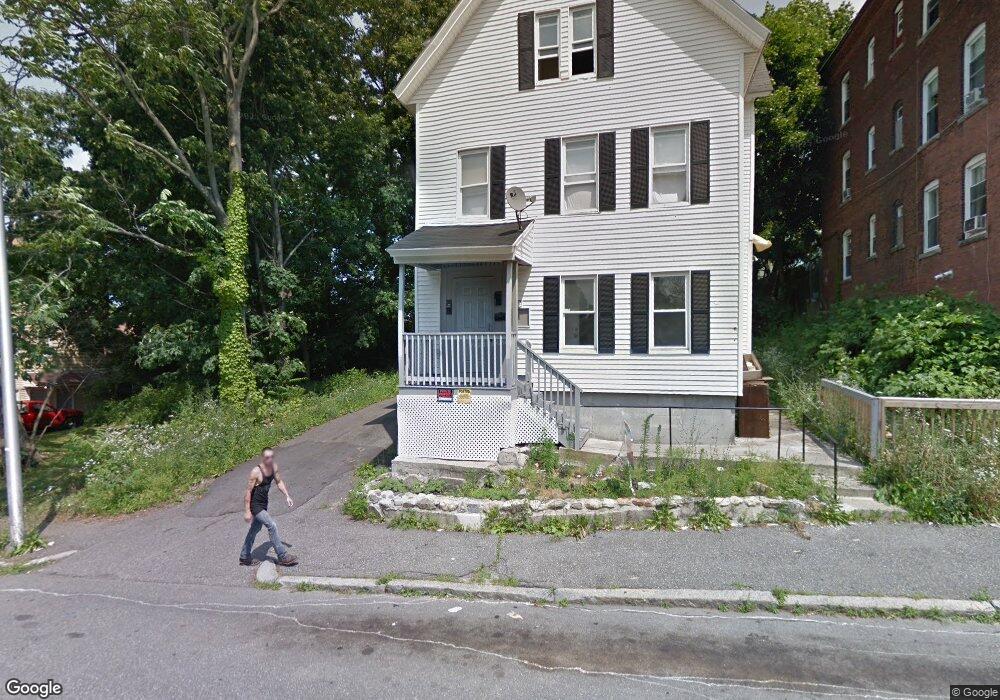
81 Bellevue St Worcester, MA 01610
University Park NeighborhoodEstimated Value: $652,000 - $739,000
8
Beds
3
Baths
2,638
Sq Ft
$260/Sq Ft
Est. Value
About This Home
This home is located at 81 Bellevue St, Worcester, MA 01610 and is currently estimated at $685,333, approximately $259 per square foot. 81 Bellevue St is a home located in Worcester County with nearby schools including Chandler Elementary Community School, Jacob Hiatt Magnet School, and Chandler Magnet.
Ownership History
Date
Name
Owned For
Owner Type
Purchase Details
Closed on
Nov 14, 2012
Sold by
Itc Rt
Bought by
Icc Props Llc
Current Estimated Value
Home Financials for this Owner
Home Financials are based on the most recent Mortgage that was taken out on this home.
Original Mortgage
$119,700
Outstanding Balance
$82,715
Interest Rate
3.39%
Mortgage Type
New Conventional
Estimated Equity
$602,618
Purchase Details
Closed on
Jul 29, 2011
Sold by
Barsamian Donna
Bought by
Itc Rt
Create a Home Valuation Report for This Property
The Home Valuation Report is an in-depth analysis detailing your home's value as well as a comparison with similar homes in the area
Home Values in the Area
Average Home Value in this Area
Purchase History
| Date | Buyer | Sale Price | Title Company |
|---|---|---|---|
| Icc Props Llc | -- | -- | |
| Itc Rt | $92,000 | -- |
Source: Public Records
Mortgage History
| Date | Status | Borrower | Loan Amount |
|---|---|---|---|
| Open | Icc Props Llc | $119,700 |
Source: Public Records
Tax History Compared to Growth
Tax History
| Year | Tax Paid | Tax Assessment Tax Assessment Total Assessment is a certain percentage of the fair market value that is determined by local assessors to be the total taxable value of land and additions on the property. | Land | Improvement |
|---|---|---|---|---|
| 2025 | $6,733 | $510,500 | $70,200 | $440,300 |
| 2024 | $6,546 | $476,100 | $70,200 | $405,900 |
| 2023 | $5,996 | $418,100 | $56,300 | $361,800 |
| 2022 | $5,406 | $355,400 | $45,000 | $310,400 |
| 2021 | $4,438 | $272,600 | $36,000 | $236,600 |
| 2020 | $4,146 | $243,900 | $36,200 | $207,700 |
| 2019 | $2,653 | $147,400 | $35,600 | $111,800 |
| 2018 | $2,700 | $142,800 | $35,600 | $107,200 |
| 2017 | $2,572 | $133,800 | $35,600 | $98,200 |
| 2016 | $2,539 | $123,200 | $29,600 | $93,600 |
| 2015 | $2,473 | $123,200 | $29,600 | $93,600 |
| 2014 | $2,407 | $123,200 | $29,600 | $93,600 |
Source: Public Records
Map
Nearby Homes