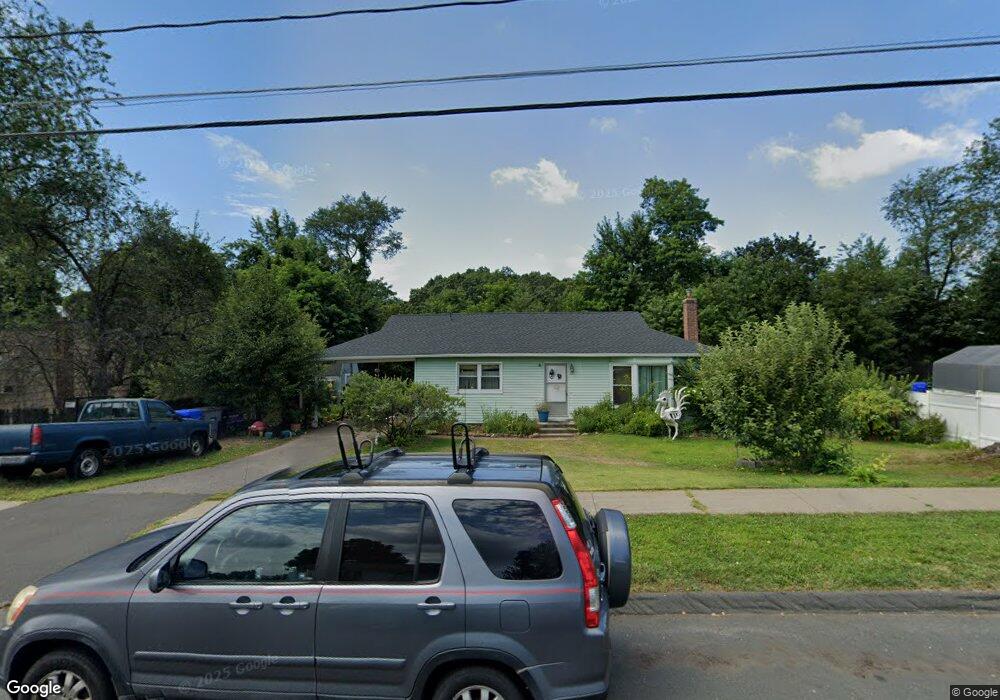
81 Brett Ln Enfield, CT 06082
Estimated Value: $268,000 - $299,127
3
Beds
2
Baths
1,064
Sq Ft
$270/Sq Ft
Est. Value
About This Home
This home is located at 81 Brett Ln, Enfield, CT 06082 and is currently estimated at $287,282, approximately $270 per square foot. 81 Brett Ln is a home located in Hartford County with nearby schools including Nathan Hale Elementary School, Eli Whitney Elementary School, and Enfield High School.
Ownership History
Date
Name
Owned For
Owner Type
Purchase Details
Closed on
May 2, 2008
Sold by
Oquendo Jose
Bought by
Fournier Carson
Current Estimated Value
Home Financials for this Owner
Home Financials are based on the most recent Mortgage that was taken out on this home.
Original Mortgage
$152,506
Outstanding Balance
$97,136
Interest Rate
5.99%
Estimated Equity
$190,146
Purchase Details
Closed on
Mar 1, 2001
Sold by
Est Elko Wilma and Elko Richard
Bought by
Quendo Jose O
Create a Home Valuation Report for This Property
The Home Valuation Report is an in-depth analysis detailing your home's value as well as a comparison with similar homes in the area
Home Values in the Area
Average Home Value in this Area
Purchase History
| Date | Buyer | Sale Price | Title Company |
|---|---|---|---|
| Fournier Carson | $154,900 | -- | |
| Quendo Jose O | $89,900 | -- |
Source: Public Records
Mortgage History
| Date | Status | Borrower | Loan Amount |
|---|---|---|---|
| Open | Quendo Jose O | $152,506 | |
| Previous Owner | Quendo Jose O | $10,000 | |
| Previous Owner | Quendo Jose O | $145,600 | |
| Previous Owner | Quendo Jose O | $10,000 |
Source: Public Records
Tax History
| Year | Tax Paid | Tax Assessment Tax Assessment Total Assessment is a certain percentage of the fair market value that is determined by local assessors to be the total taxable value of land and additions on the property. | Land | Improvement |
|---|---|---|---|---|
| 2025 | $4,739 | $135,000 | $53,800 | $81,200 |
| 2024 | $4,564 | $135,000 | $53,800 | $81,200 |
| 2023 | $4,531 | $135,000 | $53,800 | $81,200 |
| 2022 | $4,170 | $135,000 | $53,800 | $81,200 |
| 2021 | $3,969 | $105,650 | $44,550 | $61,100 |
| 2020 | $3,943 | $105,650 | $44,550 | $61,100 |
| 2019 | $3,938 | $105,650 | $44,550 | $61,100 |
| 2018 | $3,832 | $105,650 | $44,550 | $61,100 |
| 2017 | $3,601 | $105,650 | $44,550 | $61,100 |
| 2016 | $3,513 | $105,310 | $45,710 | $59,600 |
| 2015 | $3,406 | $105,310 | $45,710 | $59,600 |
| 2014 | $3,320 | $105,310 | $45,710 | $59,600 |
Source: Public Records
Map
Nearby Homes
Your Personal Tour Guide
Ask me questions while you tour the home.