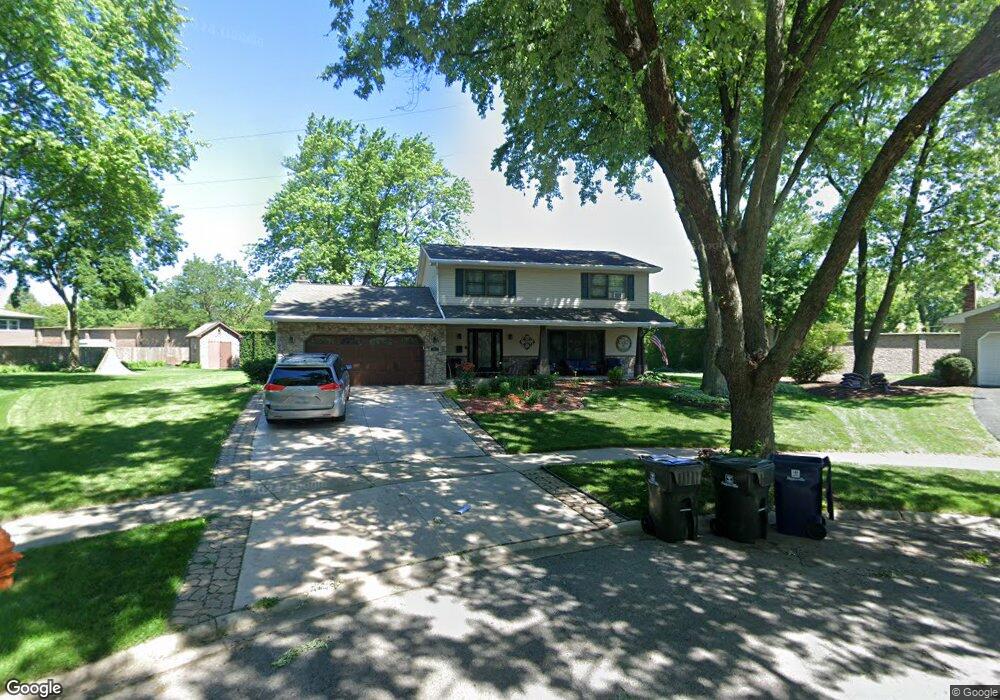
81 Bunting Ln Naperville, IL 60565
Maple Brook NeighborhoodEstimated Value: $547,000 - $629,000
4
Beds
3
Baths
2,190
Sq Ft
$267/Sq Ft
Est. Value
About This Home
This home is located at 81 Bunting Ln, Naperville, IL 60565 and is currently estimated at $584,176, approximately $266 per square foot. 81 Bunting Ln is a home located in DuPage County with nearby schools including Maplebrook Elementary School, Lincoln Jr. High School, and Naperville Central High School.
Ownership History
Date
Name
Owned For
Owner Type
Purchase Details
Closed on
Sep 15, 2020
Sold by
Houchin Barhaugn Kelly
Bought by
Barhaugh Darran M and Houchin Barhaugh Kelly
Current Estimated Value
Home Financials for this Owner
Home Financials are based on the most recent Mortgage that was taken out on this home.
Original Mortgage
$192,000
Outstanding Balance
$170,071
Interest Rate
2.8%
Mortgage Type
New Conventional
Estimated Equity
$414,105
Purchase Details
Closed on
Feb 2, 2004
Sold by
Conroy David S and Conroy Kristen B
Bought by
Houchin Kelly
Home Financials for this Owner
Home Financials are based on the most recent Mortgage that was taken out on this home.
Original Mortgage
$236,000
Interest Rate
4.87%
Mortgage Type
Negative Amortization
Purchase Details
Closed on
May 17, 1995
Sold by
Ambre Jerome M and Ambre Arlene F
Bought by
Conroy David S and Conroy Kristen B
Home Financials for this Owner
Home Financials are based on the most recent Mortgage that was taken out on this home.
Original Mortgage
$144,000
Interest Rate
8.26%
Create a Home Valuation Report for This Property
The Home Valuation Report is an in-depth analysis detailing your home's value as well as a comparison with similar homes in the area
Home Values in the Area
Average Home Value in this Area
Purchase History
| Date | Buyer | Sale Price | Title Company |
|---|---|---|---|
| Barhaugh Darran M | -- | Fidelity National Title Comp | |
| Houchin Kelly | $296,000 | Ctic | |
| Conroy David S | $180,000 | -- |
Source: Public Records
Mortgage History
| Date | Status | Borrower | Loan Amount |
|---|---|---|---|
| Open | Barhaugh Darran M | $192,000 | |
| Closed | Houchin Kelly | $236,000 | |
| Previous Owner | Conroy David S | $144,000 |
Source: Public Records
Tax History Compared to Growth
Tax History
| Year | Tax Paid | Tax Assessment Tax Assessment Total Assessment is a certain percentage of the fair market value that is determined by local assessors to be the total taxable value of land and additions on the property. | Land | Improvement |
|---|---|---|---|---|
| 2024 | $8,372 | $144,655 | $66,860 | $77,795 |
| 2023 | $8,059 | $132,020 | $61,020 | $71,000 |
| 2022 | $7,749 | $125,730 | $58,110 | $67,620 |
| 2021 | $7,463 | $120,970 | $55,910 | $65,060 |
| 2020 | $7,302 | $118,790 | $54,900 | $63,890 |
| 2019 | $7,086 | $113,660 | $52,530 | $61,130 |
| 2018 | $6,906 | $110,890 | $51,250 | $59,640 |
| 2017 | $6,764 | $107,150 | $49,520 | $57,630 |
| 2016 | $6,626 | $103,280 | $47,730 | $55,550 |
| 2015 | $6,578 | $97,260 | $44,950 | $52,310 |
| 2014 | $6,448 | $92,630 | $42,810 | $49,820 |
| 2013 | $6,351 | $92,850 | $42,910 | $49,940 |
Source: Public Records
Map
Nearby Homes
- 1408 Swallow St
- 165 Tamarack Ave
- 213 Winding Creek Dr
- 1443 Meander Dr
- 8S452 Bell Dr
- 344 Waxwing Ave
- 1449 Whitespire Ct Unit 5104
- 1721 S Washington St Unit 1721
- 128 E Bailey Rd Unit G
- 1751 S Washington St Unit 1
- 158 E Bailey Rd Unit F
- 138 E Bailey Rd Unit M
- 907 Secretariat Dr
- 908 Julian Ct
- 923 Tim Tam Cir
- 425 W Gartner Rd
- 616 Driftwood Ct
- 621 Bourbon Ct
- 821 Wellner Rd
- 225 Elmwood Dr