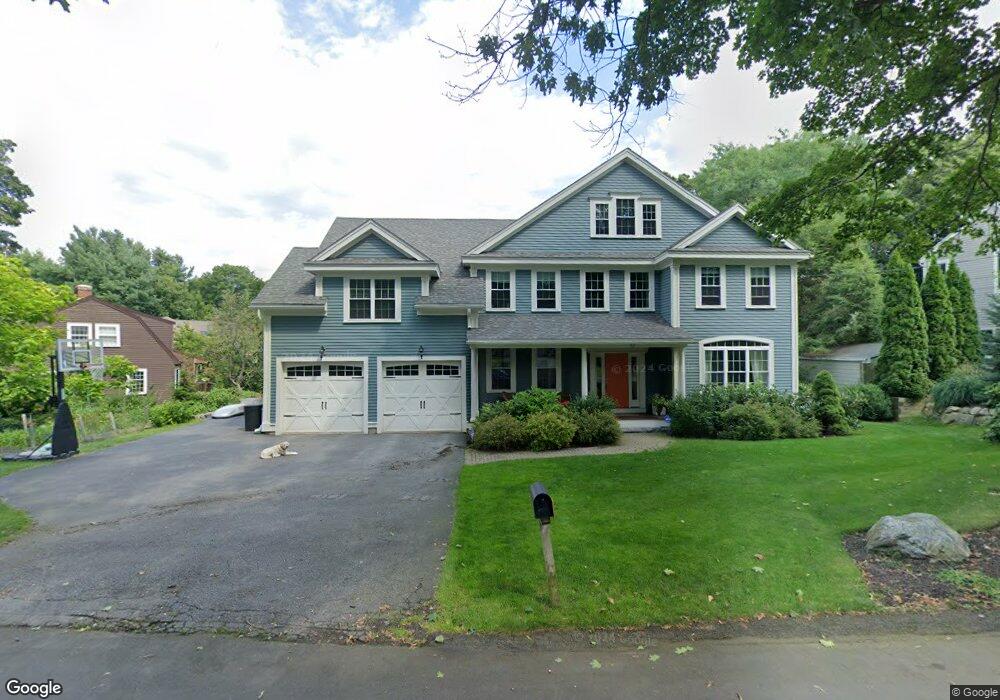
81 Cedar St Lexington, MA 02421
North Lexington NeighborhoodEstimated Value: $2,441,542 - $3,053,000
5
Beds
4
Baths
4,952
Sq Ft
$564/Sq Ft
Est. Value
About This Home
This home is located at 81 Cedar St, Lexington, MA 02421 and is currently estimated at $2,791,636, approximately $563 per square foot. 81 Cedar St is a home located in Middlesex County with nearby schools including Maria Hastings Elementary School, William Diamond Middle School, and Lexington High School.
Ownership History
Date
Name
Owned For
Owner Type
Purchase Details
Closed on
Dec 9, 2020
Sold by
Bracken Mark E and Bracken Stacie M
Bought by
Stacie M Brakcen T
Current Estimated Value
Purchase Details
Closed on
Apr 29, 2010
Sold by
Delaney Justin W and Delaney Carrie A
Bought by
Bracken Mark E and Bracken Stacie M
Home Financials for this Owner
Home Financials are based on the most recent Mortgage that was taken out on this home.
Original Mortgage
$780,000
Interest Rate
4.99%
Mortgage Type
Purchase Money Mortgage
Purchase Details
Closed on
Mar 16, 2007
Sold by
Devito Carl M
Bought by
Delaney Carrie A and Delaney Justin W
Home Financials for this Owner
Home Financials are based on the most recent Mortgage that was taken out on this home.
Original Mortgage
$850,000
Interest Rate
6%
Mortgage Type
Purchase Money Mortgage
Purchase Details
Closed on
May 23, 2006
Sold by
81 Cedar Street Rt
Bought by
Devito Carl M
Create a Home Valuation Report for This Property
The Home Valuation Report is an in-depth analysis detailing your home's value as well as a comparison with similar homes in the area
Home Values in the Area
Average Home Value in this Area
Purchase History
| Date | Buyer | Sale Price | Title Company |
|---|---|---|---|
| Stacie M Brakcen T | -- | None Available | |
| Bracken Mark E | $1,375,000 | -- | |
| Delaney Carrie A | $526,000 | -- | |
| Devito Carl M | -- | -- |
Source: Public Records
Mortgage History
| Date | Status | Borrower | Loan Amount |
|---|---|---|---|
| Previous Owner | Bracken Mark E | $780,000 | |
| Previous Owner | Delaney Carrie A | $850,000 |
Source: Public Records
Tax History
| Year | Tax Paid | Tax Assessment Tax Assessment Total Assessment is a certain percentage of the fair market value that is determined by local assessors to be the total taxable value of land and additions on the property. | Land | Improvement |
|---|---|---|---|---|
| 2025 | $26,515 | $2,168,000 | $854,000 | $1,314,000 |
| 2024 | $25,860 | $2,111,000 | $814,000 | $1,297,000 |
| 2023 | $24,128 | $1,856,000 | $740,000 | $1,116,000 |
| 2022 | $23,308 | $1,689,000 | $673,000 | $1,016,000 |
| 2021 | $23,182 | $1,611,000 | $613,000 | $998,000 |
| 2020 | $21,567 | $1,535,000 | $613,000 | $922,000 |
| 2019 | $21,081 | $1,493,000 | $584,000 | $909,000 |
| 2018 | $20,235 | $1,415,000 | $556,000 | $859,000 |
| 2017 | $21,083 | $1,455,000 | $544,000 | $911,000 |
| 2016 | $20,776 | $1,423,000 | $495,000 | $928,000 |
| 2015 | $19,972 | $1,344,000 | $450,000 | $894,000 |
| 2014 | $19,496 | $1,257,000 | $409,000 | $848,000 |
Source: Public Records
Map
Nearby Homes
Your Personal Tour Guide
Ask me questions while you tour the home.