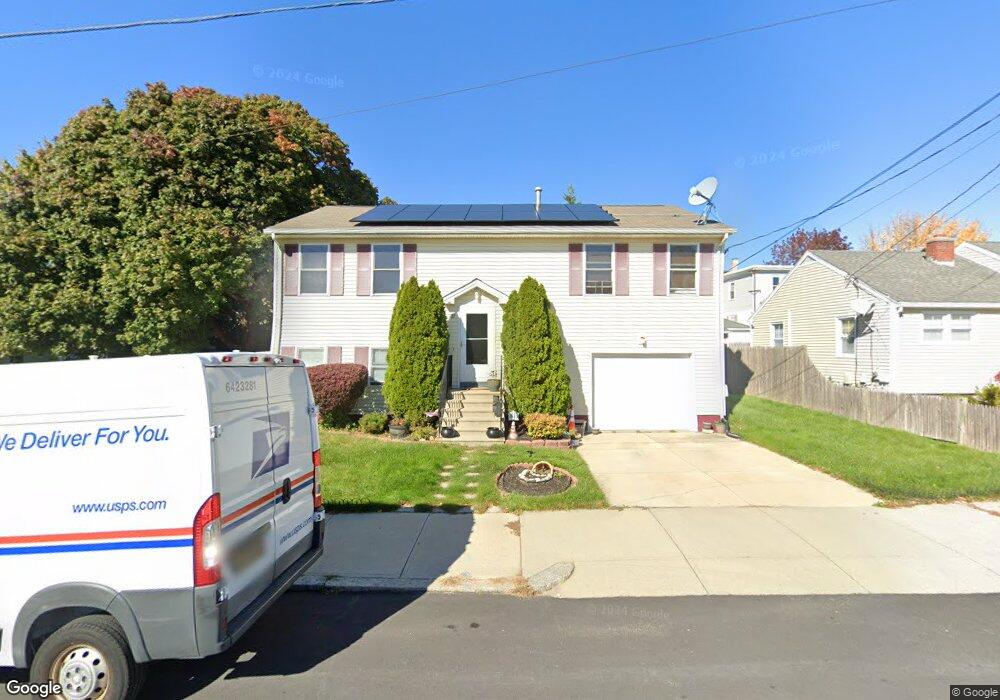
81 Chaucer St Providence, RI 02908
Mount Pleasant NeighborhoodEstimated Value: $365,000 - $551,000
2
Beds
2
Baths
1,560
Sq Ft
$281/Sq Ft
Est. Value
About This Home
This home is located at 81 Chaucer St, Providence, RI 02908 and is currently estimated at $438,389, approximately $281 per square foot. 81 Chaucer St is a home located in Providence County with nearby schools including Charles N. Fortes Elementary School, Asa Messer Elementary School, and Laurel Hill Annex School.
Ownership History
Date
Name
Owned For
Owner Type
Purchase Details
Closed on
Mar 2, 2010
Sold by
Rbs Citizens Na
Bought by
Brown Perry
Current Estimated Value
Home Financials for this Owner
Home Financials are based on the most recent Mortgage that was taken out on this home.
Original Mortgage
$145,809
Outstanding Balance
$96,886
Interest Rate
5.11%
Mortgage Type
Purchase Money Mortgage
Estimated Equity
$341,503
Purchase Details
Closed on
Dec 15, 2009
Sold by
Algria Cesar A
Bought by
Rbs Citizens Bank Na
Purchase Details
Closed on
Sep 1, 2005
Sold by
Lisi Donald and Teto Richard J
Bought by
Alegria Cesar A
Home Financials for this Owner
Home Financials are based on the most recent Mortgage that was taken out on this home.
Original Mortgage
$206,450
Interest Rate
5.81%
Mortgage Type
Purchase Money Mortgage
Create a Home Valuation Report for This Property
The Home Valuation Report is an in-depth analysis detailing your home's value as well as a comparison with similar homes in the area
Home Values in the Area
Average Home Value in this Area
Purchase History
| Date | Buyer | Sale Price | Title Company |
|---|---|---|---|
| Brown Perry | $148,500 | -- | |
| Rbs Citizens Bank Na | $82,473 | -- | |
| Alegria Cesar A | $256,500 | -- |
Source: Public Records
Mortgage History
| Date | Status | Borrower | Loan Amount |
|---|---|---|---|
| Open | Alegria Cesar A | $145,809 | |
| Previous Owner | Alegria Cesar A | $200,000 | |
| Previous Owner | Alegria Cesar A | $13,250 | |
| Previous Owner | Alegria Cesar A | $206,450 |
Source: Public Records
Tax History Compared to Growth
Tax History
| Year | Tax Paid | Tax Assessment Tax Assessment Total Assessment is a certain percentage of the fair market value that is determined by local assessors to be the total taxable value of land and additions on the property. | Land | Improvement |
|---|---|---|---|---|
| 2025 | $3,442 | $409,800 | $129,800 | $280,000 |
| 2024 | $5,599 | $305,100 | $75,000 | $230,100 |
| 2023 | $5,599 | $305,100 | $75,000 | $230,100 |
| 2022 | $5,431 | $305,100 | $75,000 | $230,100 |
| 2021 | $5,190 | $211,300 | $54,900 | $156,400 |
| 2020 | $5,190 | $211,300 | $54,900 | $156,400 |
| 2019 | $5,190 | $211,300 | $54,900 | $156,400 |
| 2018 | $4,903 | $153,400 | $35,200 | $118,200 |
| 2017 | $4,903 | $153,400 | $35,200 | $118,200 |
| 2016 | $4,903 | $153,400 | $35,200 | $118,200 |
| 2015 | $4,214 | $127,300 | $32,300 | $95,000 |
| 2014 | $4,296 | $127,300 | $32,300 | $95,000 |
| 2013 | $4,296 | $127,300 | $32,300 | $95,000 |
Source: Public Records
Map
Nearby Homes