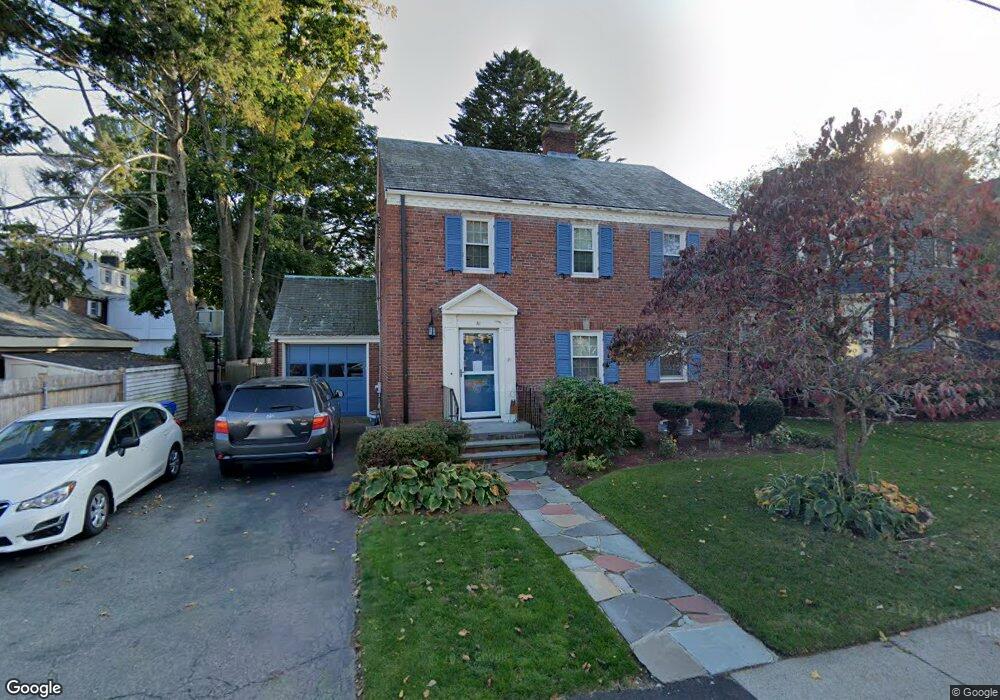
81 Clinton Place Newton Center, MA 02459
Newton Centre NeighborhoodEstimated Value: $1,521,000 - $1,621,000
3
Beds
3
Baths
1,820
Sq Ft
$867/Sq Ft
Est. Value
About This Home
This home is located at 81 Clinton Place, Newton Center, MA 02459 and is currently estimated at $1,577,044, approximately $866 per square foot. 81 Clinton Place is a home located in Middlesex County with nearby schools including Mason Rice Elementary School, Charles E Brown Middle School, and Newton North High School.
Ownership History
Date
Name
Owned For
Owner Type
Purchase Details
Closed on
Aug 15, 2025
Sold by
Alan L Vogel T L and Alan Vogel
Bought by
Rothschild Michelle A and Rothschild Eli
Current Estimated Value
Home Financials for this Owner
Home Financials are based on the most recent Mortgage that was taken out on this home.
Original Mortgage
$842,463
Outstanding Balance
$840,240
Interest Rate
6.67%
Mortgage Type
Purchase Money Mortgage
Estimated Equity
$736,804
Purchase Details
Closed on
May 7, 2021
Sold by
Vogel Alan L and Vogel Cheryl L
Bought by
Alan L Vogel T L and Alan Vogel
Purchase Details
Closed on
Aug 28, 2006
Sold by
Dembe Michelle A
Bought by
Vogel Alan L and Vogel Cheryl A
Home Financials for this Owner
Home Financials are based on the most recent Mortgage that was taken out on this home.
Original Mortgage
$468,700
Interest Rate
6.83%
Mortgage Type
Purchase Money Mortgage
Purchase Details
Closed on
Feb 9, 2005
Sold by
Dembe Allard
Bought by
Dembe Michelle A
Purchase Details
Closed on
Sep 21, 1987
Sold by
Wanyler Thomas E
Bought by
Dembe Allard
Create a Home Valuation Report for This Property
The Home Valuation Report is an in-depth analysis detailing your home's value as well as a comparison with similar homes in the area
Home Values in the Area
Average Home Value in this Area
Purchase History
| Date | Buyer | Sale Price | Title Company |
|---|---|---|---|
| Rothschild Michelle A | $1,589,950 | -- | |
| Rothschild Michelle A | $1,589,950 | -- | |
| Alan L Vogel T L | -- | None Available | |
| Alan L Vogel T L | -- | None Available | |
| Vogel Alan L | $710,000 | -- | |
| Vogel Alan L | $710,000 | -- | |
| Vogel Alan L | $710,000 | -- | |
| Dembe Michelle A | -- | -- | |
| Dembe Michelle A | -- | -- | |
| Dembe Michelle A | -- | -- | |
| Dembe Allard | $280,000 | -- |
Source: Public Records
Mortgage History
| Date | Status | Borrower | Loan Amount |
|---|---|---|---|
| Open | Rothschild Michelle A | $842,463 | |
| Closed | Rothschild Michelle A | $842,463 | |
| Previous Owner | Vogel Alan L | $468,700 |
Source: Public Records
Tax History Compared to Growth
Tax History
| Year | Tax Paid | Tax Assessment Tax Assessment Total Assessment is a certain percentage of the fair market value that is determined by local assessors to be the total taxable value of land and additions on the property. | Land | Improvement |
|---|---|---|---|---|
| 2025 | $11,937 | $1,218,100 | $1,126,000 | $92,100 |
| 2024 | $11,519 | $1,180,200 | $1,093,200 | $87,000 |
| 2023 | $10,900 | $1,070,700 | $824,800 | $245,900 |
| 2022 | $10,430 | $991,400 | $763,700 | $227,700 |
| 2021 | $10,064 | $935,300 | $720,500 | $214,800 |
| 2020 | $9,765 | $935,300 | $720,500 | $214,800 |
| 2019 | $9,490 | $908,100 | $699,500 | $208,600 |
| 2018 | $9,064 | $837,700 | $631,900 | $205,800 |
| 2017 | $8,788 | $790,300 | $596,100 | $194,200 |
| 2016 | $8,405 | $738,600 | $557,100 | $181,500 |
| 2015 | $8,014 | $690,300 | $520,700 | $169,600 |
Source: Public Records
Map
Nearby Homes
- 1004 Centre St
- 73 Elmore St
- 3 Cedar St
- 44 Irving St
- 21 Francis St Unit 21A
- 23 Francis St Unit 23-1
- 31 W Boulevard Rd
- 34 Morton Rd
- 887 Commonwealth Ave
- 95 Blake St
- Lots 2 & 3 Chapin Rd
- Lot 3 Chapin Rd
- Lot 2 Chapin Rd
- 92 Grant Ave
- 59 Charlotte Rd
- 173-175 Warren St
- 686 Centre St
- 9 The Ledges Rd
- 145 Warren St Unit 4
- 35 George St Unit 35
- 75 Clinton Place
- 963 Centre St
- 971 Centre St
- 71 Clinton Place
- 78 Clinton Place
- 84 Clinton Place
- 80 Clinton Place
- 76-78 Clinton Place
- 76 Clinton Place Unit 78
- 21 Elmore St
- 92 Clinton Place
- 92 Clinton Place Unit 1
- 92 Clinton Place Unit 2
- 72 Clinton Place Unit 74
- 955 Centre St
- 67 Clinton Place
- 19 Elmore St
- 25 Elmore St
- 949 Centre St
- 68 Clinton Place