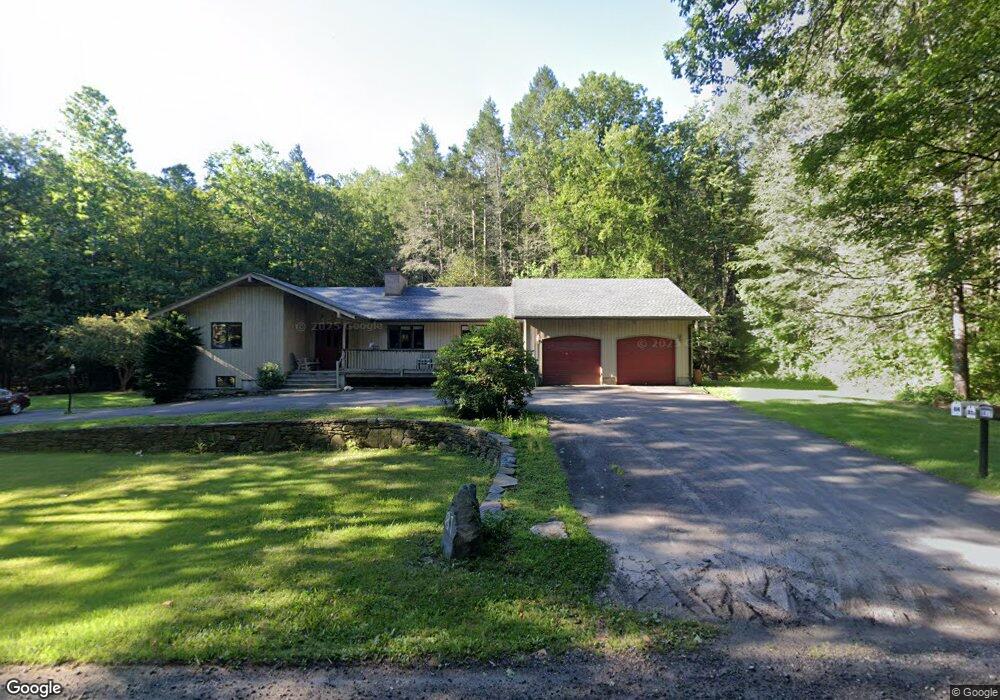
81 Conway Rd West Whately, MA 01039
Estimated Value: $468,000 - $532,280
3
Beds
3
Baths
3,059
Sq Ft
$163/Sq Ft
Est. Value
About This Home
This home is located at 81 Conway Rd, West Whately, MA 01039 and is currently estimated at $500,140, approximately $163 per square foot. 81 Conway Rd is a home with nearby schools including Whately Elementary School and Frontier Regional School.
Ownership History
Date
Name
Owned For
Owner Type
Purchase Details
Closed on
May 29, 2025
Sold by
Mason Anthony J and Mason David J
Bought by
Mason Anthony J and Mason David J
Current Estimated Value
Purchase Details
Closed on
May 22, 2009
Sold by
Mason Edward J and Mason Mary E
Bought by
Mason Edward J and Mason Mary E
Purchase Details
Closed on
Aug 31, 2006
Sold by
Mason Edward J and Mason Mary E
Bought by
Mason Christopher and Mason Jillian
Create a Home Valuation Report for This Property
The Home Valuation Report is an in-depth analysis detailing your home's value as well as a comparison with similar homes in the area
Home Values in the Area
Average Home Value in this Area
Purchase History
| Date | Buyer | Sale Price | Title Company |
|---|---|---|---|
| Mason Anthony J | -- | None Available | |
| Mason Anthony J | -- | None Available | |
| Mason Edward J | -- | -- | |
| Mason Edward J | -- | -- | |
| Mason Christopher | $10,000 | -- | |
| Mason Christopher | $10,000 | -- |
Source: Public Records
Mortgage History
| Date | Status | Borrower | Loan Amount |
|---|---|---|---|
| Previous Owner | Mason Christopher | $118,000 | |
| Previous Owner | Mason Christopher | $35,000 | |
| Previous Owner | Mason Christopher | $35,000 |
Source: Public Records
Tax History Compared to Growth
Tax History
| Year | Tax Paid | Tax Assessment Tax Assessment Total Assessment is a certain percentage of the fair market value that is determined by local assessors to be the total taxable value of land and additions on the property. | Land | Improvement |
|---|---|---|---|---|
| 2025 | $5,754 | $431,300 | $94,900 | $336,400 |
| 2024 | $5,583 | $407,800 | $99,700 | $308,100 |
| 2023 | $5,414 | $381,300 | $94,900 | $286,400 |
| 2022 | $5,228 | $381,300 | $94,900 | $286,400 |
| 2021 | $4,942 | $331,200 | $94,900 | $236,300 |
| 2020 | $5,068 | $323,400 | $92,300 | $231,100 |
| 2019 | $5,019 | $323,400 | $92,300 | $231,100 |
| 2018 | $4,961 | $323,400 | $92,300 | $231,100 |
| 2017 | $5,045 | $323,400 | $92,300 | $231,100 |
| 2016 | $4,744 | $317,100 | $92,300 | $224,800 |
| 2015 | $4,938 | $305,400 | $80,600 | $224,800 |
| 2014 | $4,816 | $305,400 | $80,600 | $224,800 |
Source: Public Records
Map
Nearby Homes
- 0 North St Unit 73407299
- LOT D Mountain Rd
- 32 Swamp Rd
- 151 Pantry Rd
- 147 Pantry Rd
- 320 West St
- 0 Pantry Rd Unit 73430264
- 86 Ashfield Rd
- 820 E Guinea Rd
- 0 Old Stage Rd Unit 73394977
- 37 N Farms Rd
- 121 West St
- 45 N Farms Rd
- 24 Elm St
- 3 Depot Rd
- 3 High St
- 1 S Main St
- 24 Graves St
- 158 Main St
- 0 Straits Rd